MODEL, SOURCES AND VALIDATION
Estimating demographic votes in New York City
Certified returns tell us how a place voted. Ecological inference estimates how those votes divide across demographic groups, without observing any individual voter’s race or education.
Every certified round
The atlas covers the eight official rounds of the 2021 Democratic mayoral primary, the three official rounds of the 2025 Democratic primary, and the 2025 mayoral general election. The Board of Elections uses simultaneous eliminations, so its three 2025 rounds differ from visualizations that eliminate one candidate at a time.
Primary rounds are reconstructed from original cast-vote records and match every certified candidate and inactive-ballot total. General-election party lines are summed for each named candidate. The 2025 general includes 2,194,204 valid mayoral votes.
Sources: 2021 certified rounds, 2025 certified rounds, and 2025 general recap.
Optimal transport with geographic information
The model extends the federal Election Atlas to multiple named candidates. Unknown demographic-by-candidate tables have exact adjusted demographic margins and exact local candidate, inactive, and nonparticipation margins. The objective combines prediction from 20 nearby block groups, a relative-entropy term with epsilon 0.02, and soft demographic polling targets.
Election precincts are intersected with 2020 Census block groups. Votes are allocated using within-block-group CVAP density, conserving precinct totals. Block-group votes remain modeled allocations; public election records do not observe them. Map outlines are simplified by four meters for display, without changing the numerical fits.
The 2021 election uses ACS 2017–2021 citizen voting-age population; 2025 uses ACS 2020–2024. Race groups are non-Hispanic except Hispanic, which includes any race. White college and non-college use an age 25+ tract education proxy. Where allocated participating ballots exceed ACS CVAP, a small local adjustment makes the demographic margin feasible while preserving its proportions.
What polling contributes
| Election | Matched stages | Survey |
|---|---|---|
| 2021 primary | Rounds 1 and 7 | Marist June 3–9 |
| 2025 primary | Round 1 | Marist June 9–12 |
| 2025 general | General | CNN and SSRS voter poll |
Polling is a soft constraint, and preelection targets receive reduced reliability. A first-choice question does not constrain an unmatched later round. Stages without matched targets share the same data-only fit under baseline, no polling, and double strength.
The polling sensitivity map shows baseline candidate share minus no-poll candidate share in percentage points, regardless of the polling selector. It measures the effect of this modeling choice, not statistical uncertainty or a confidence interval.
Reading the maps
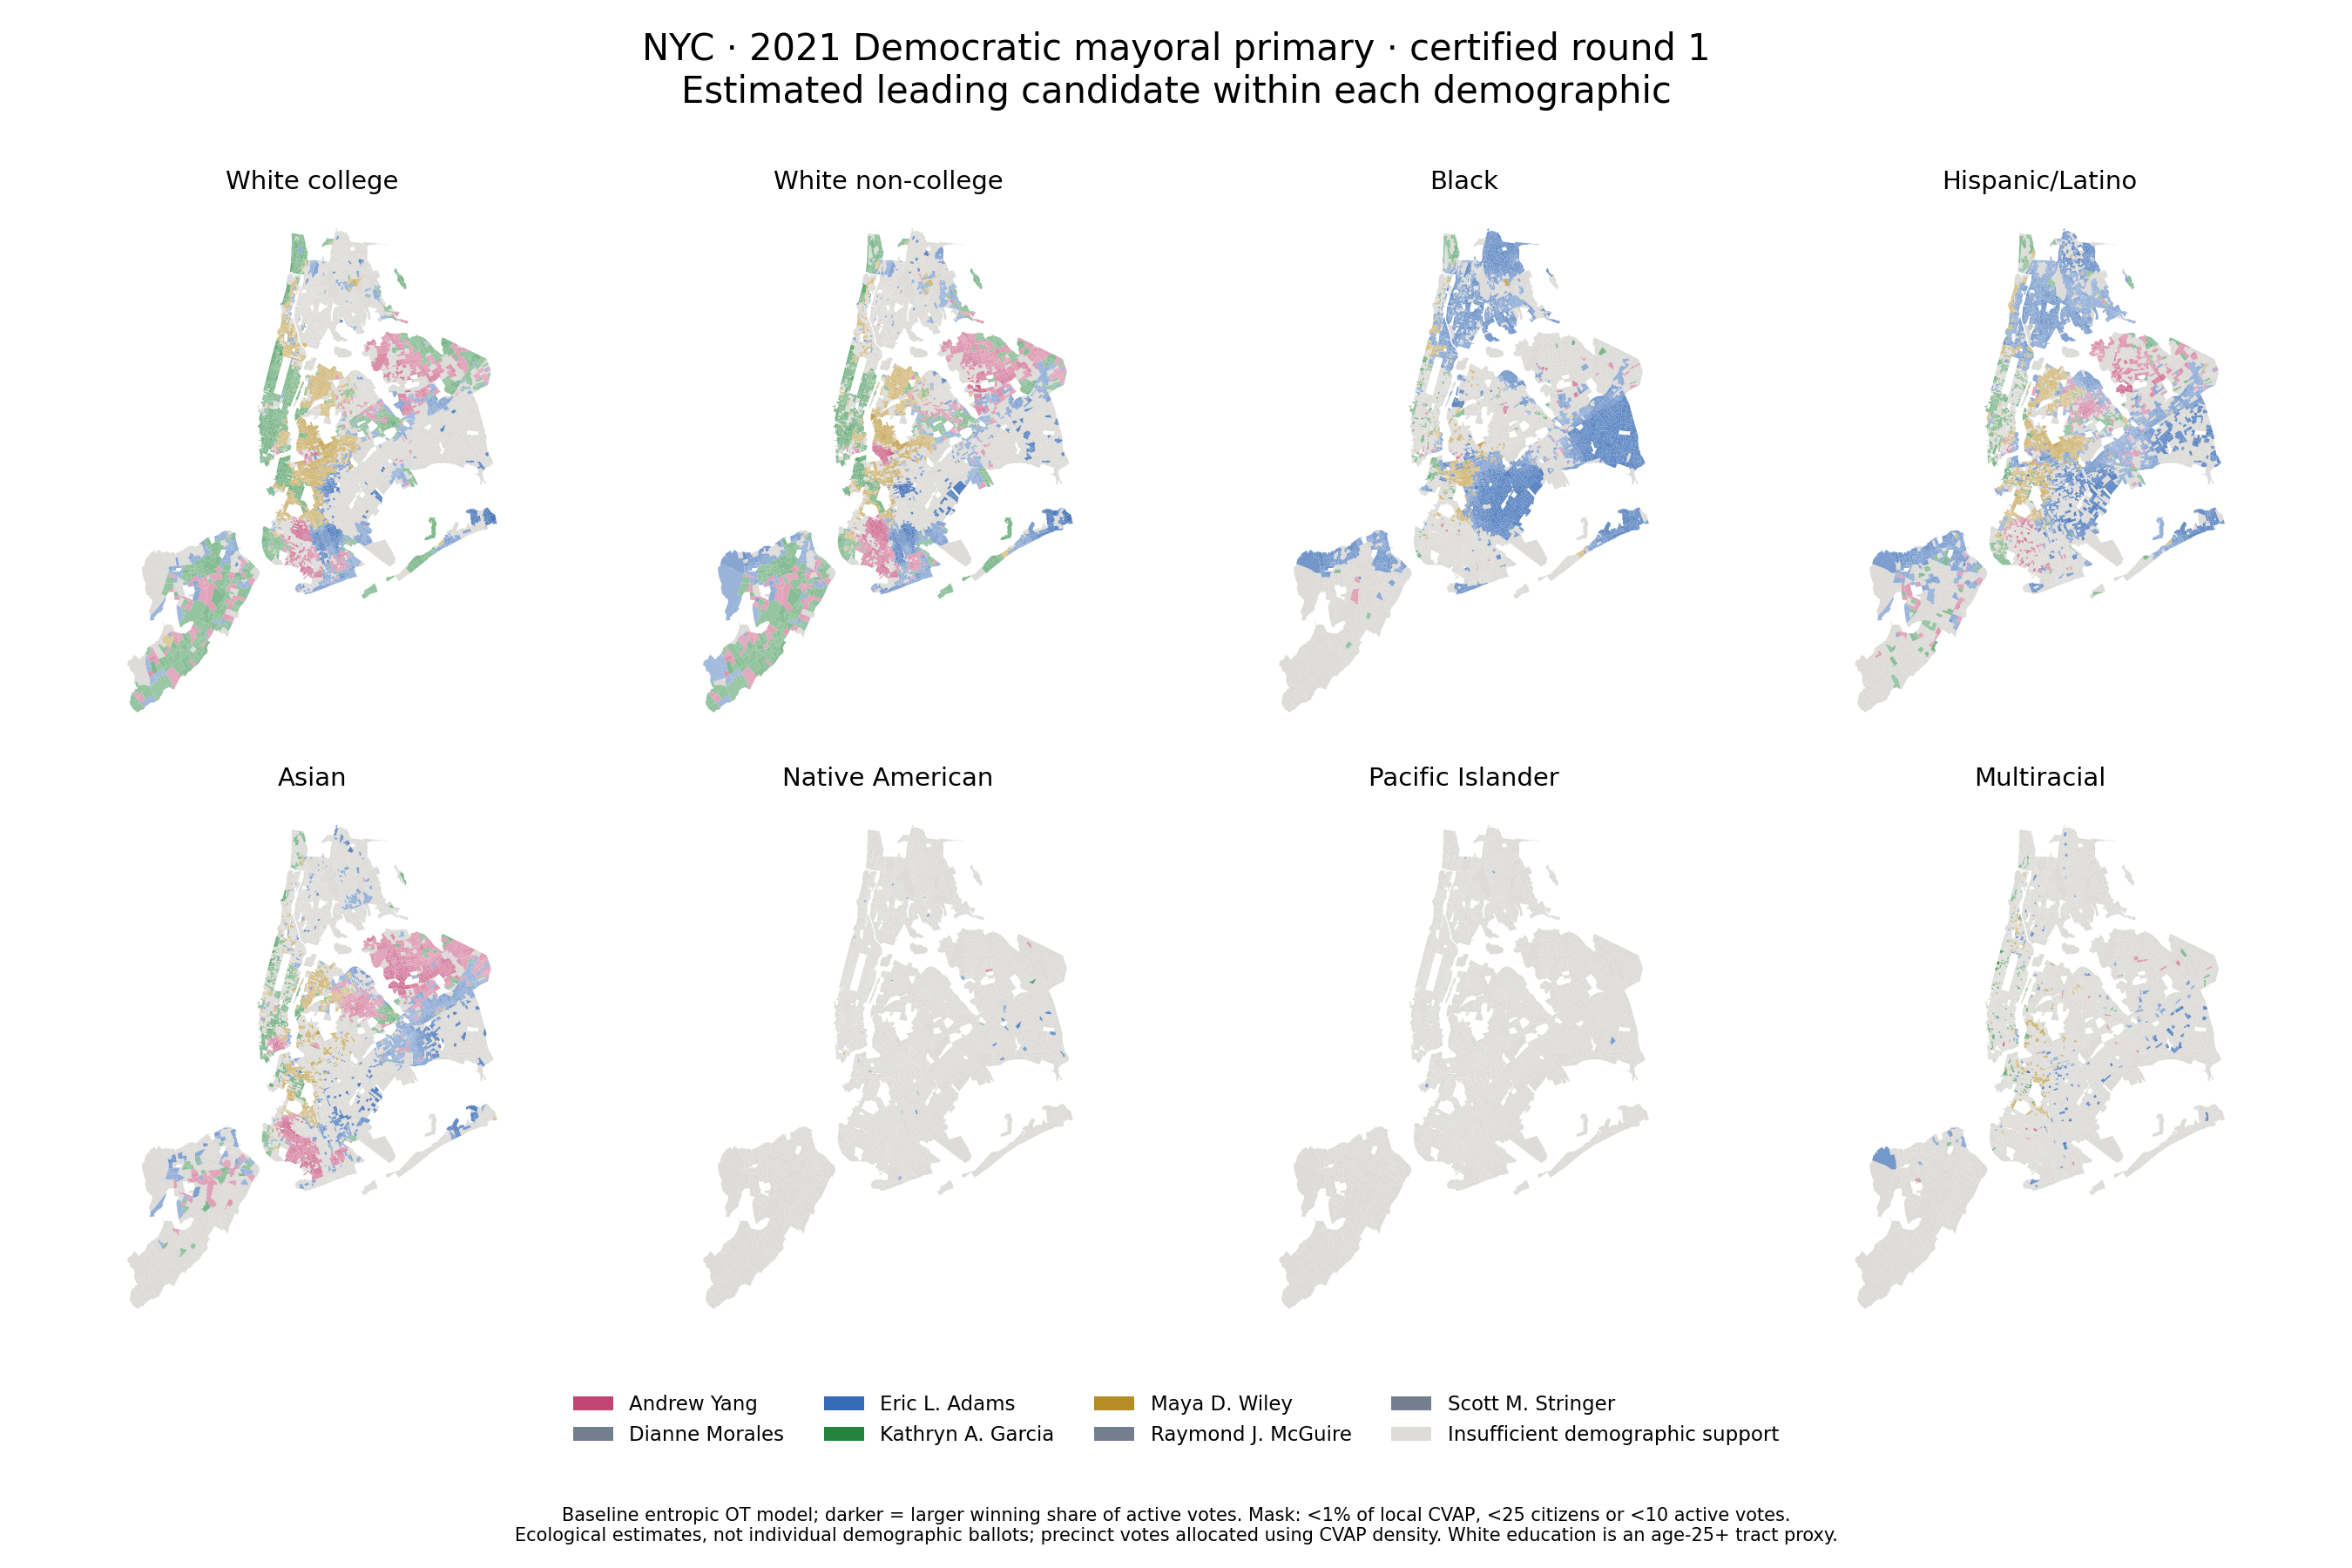
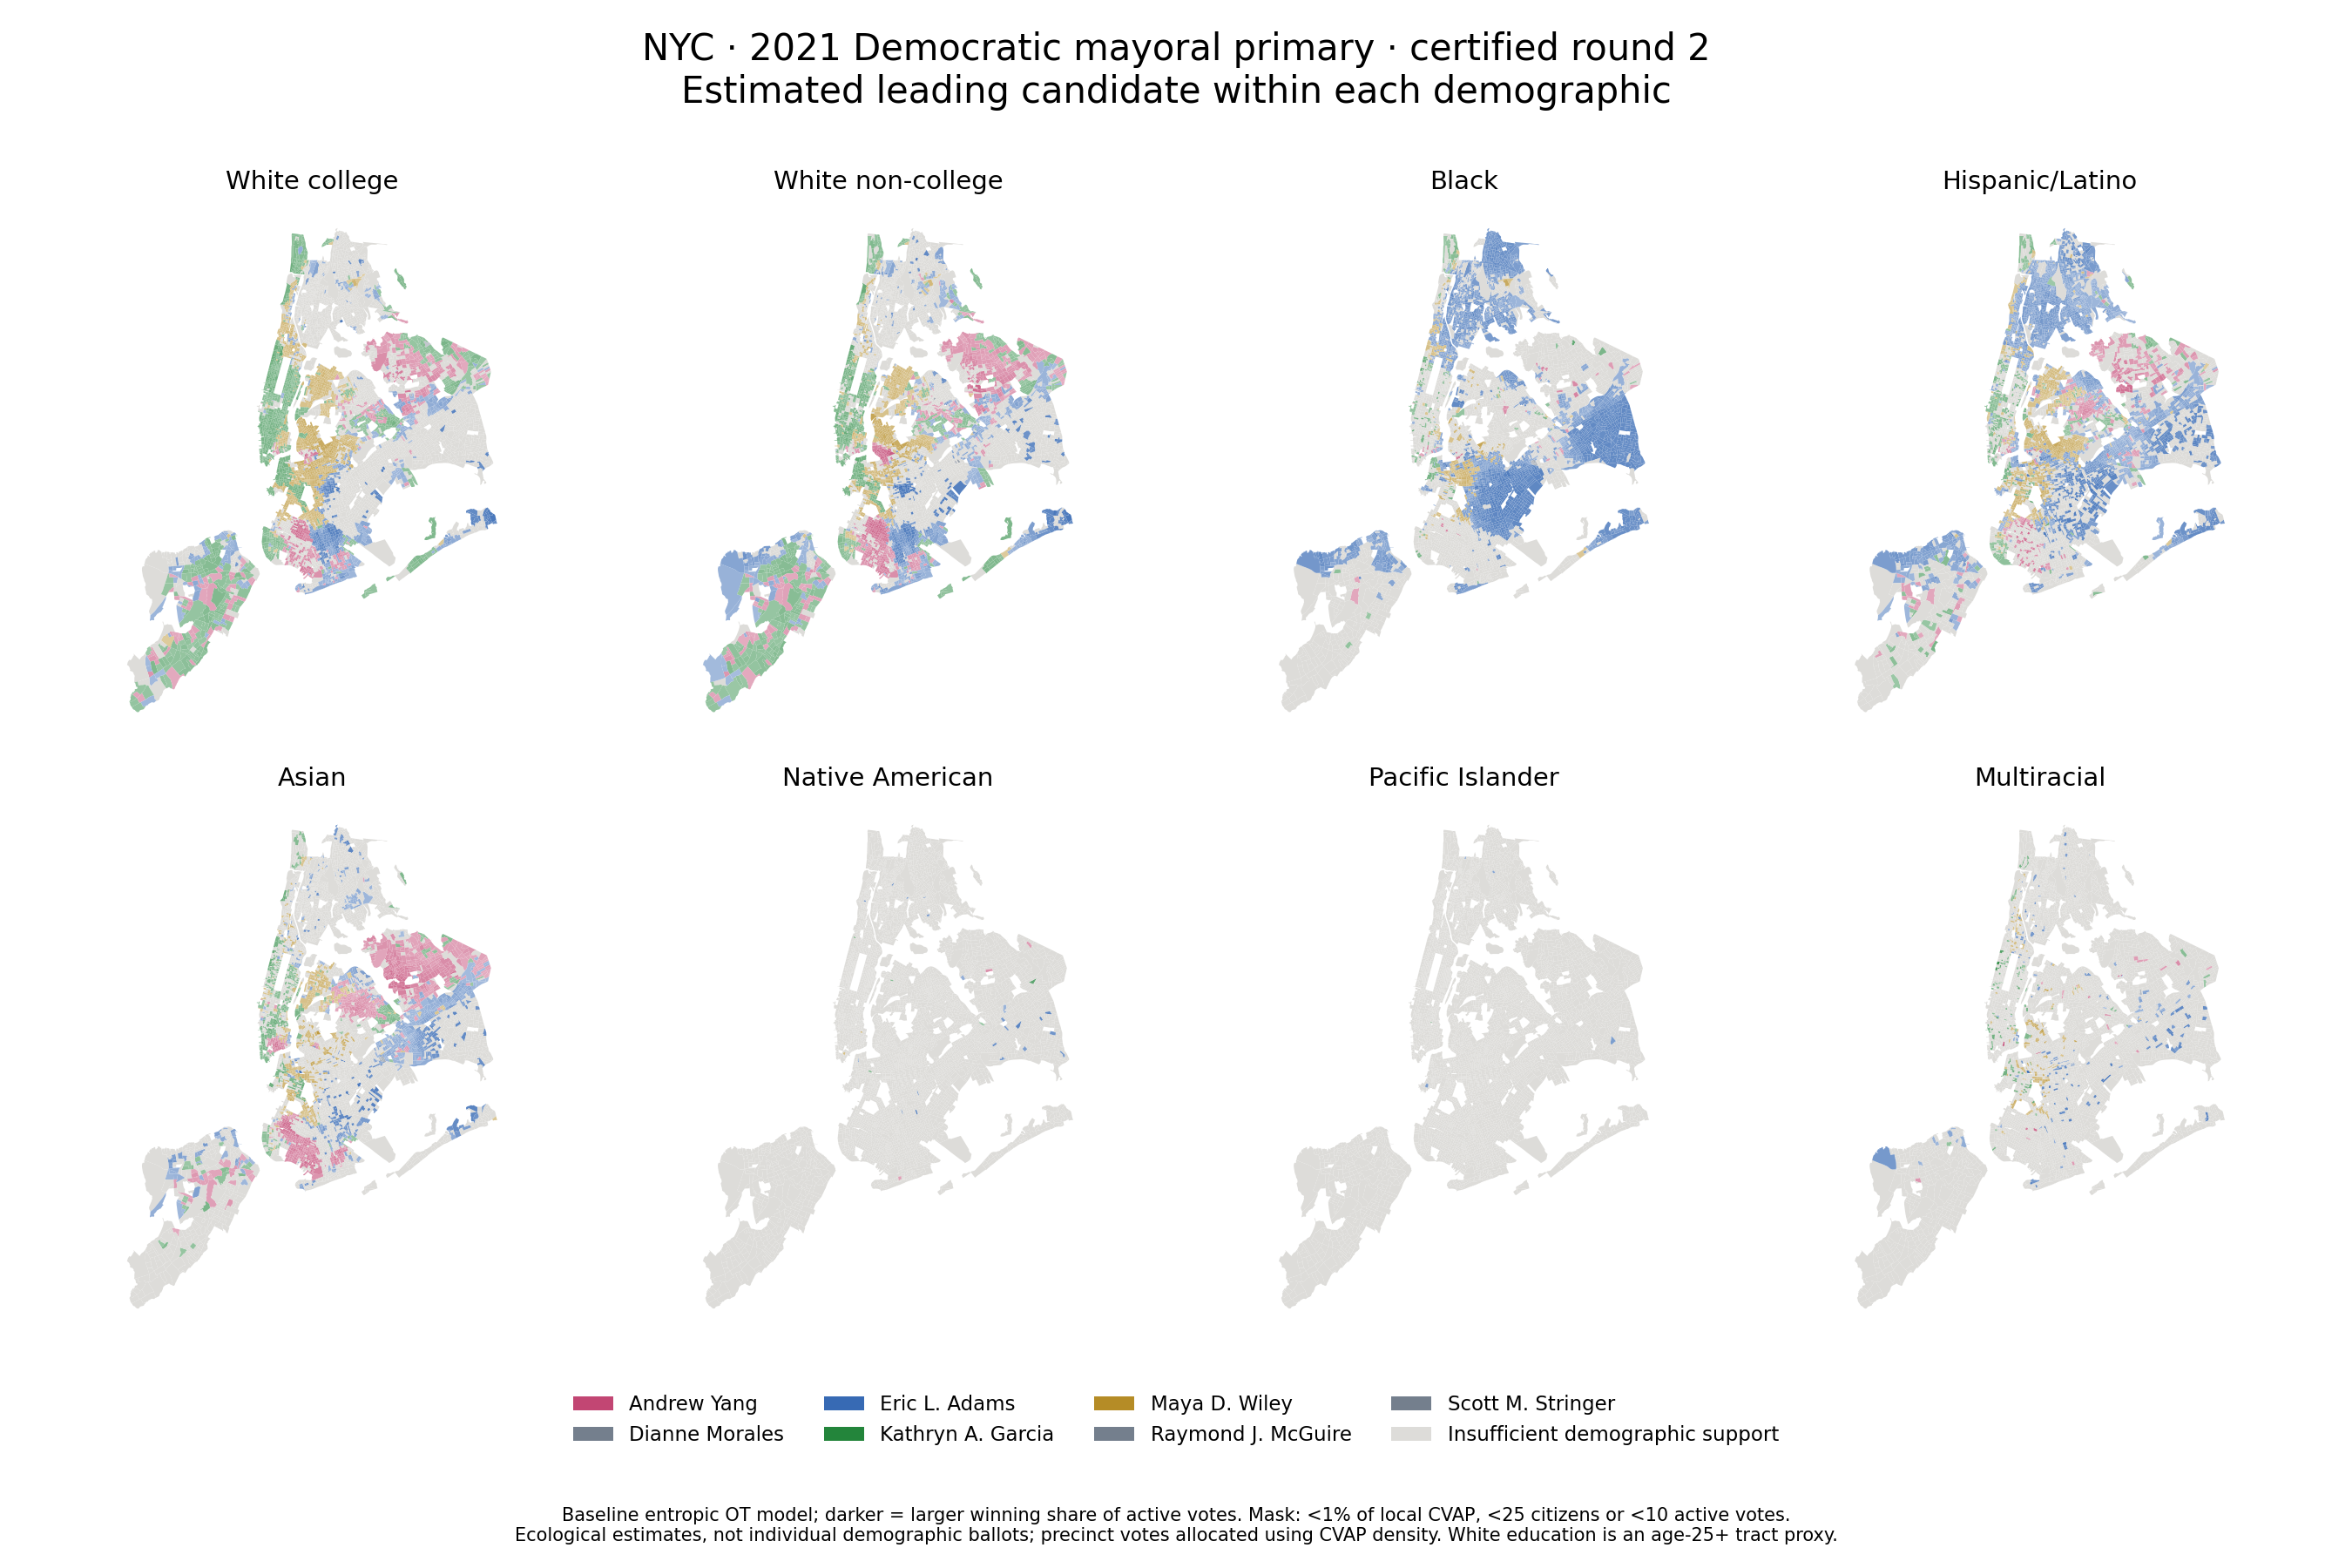
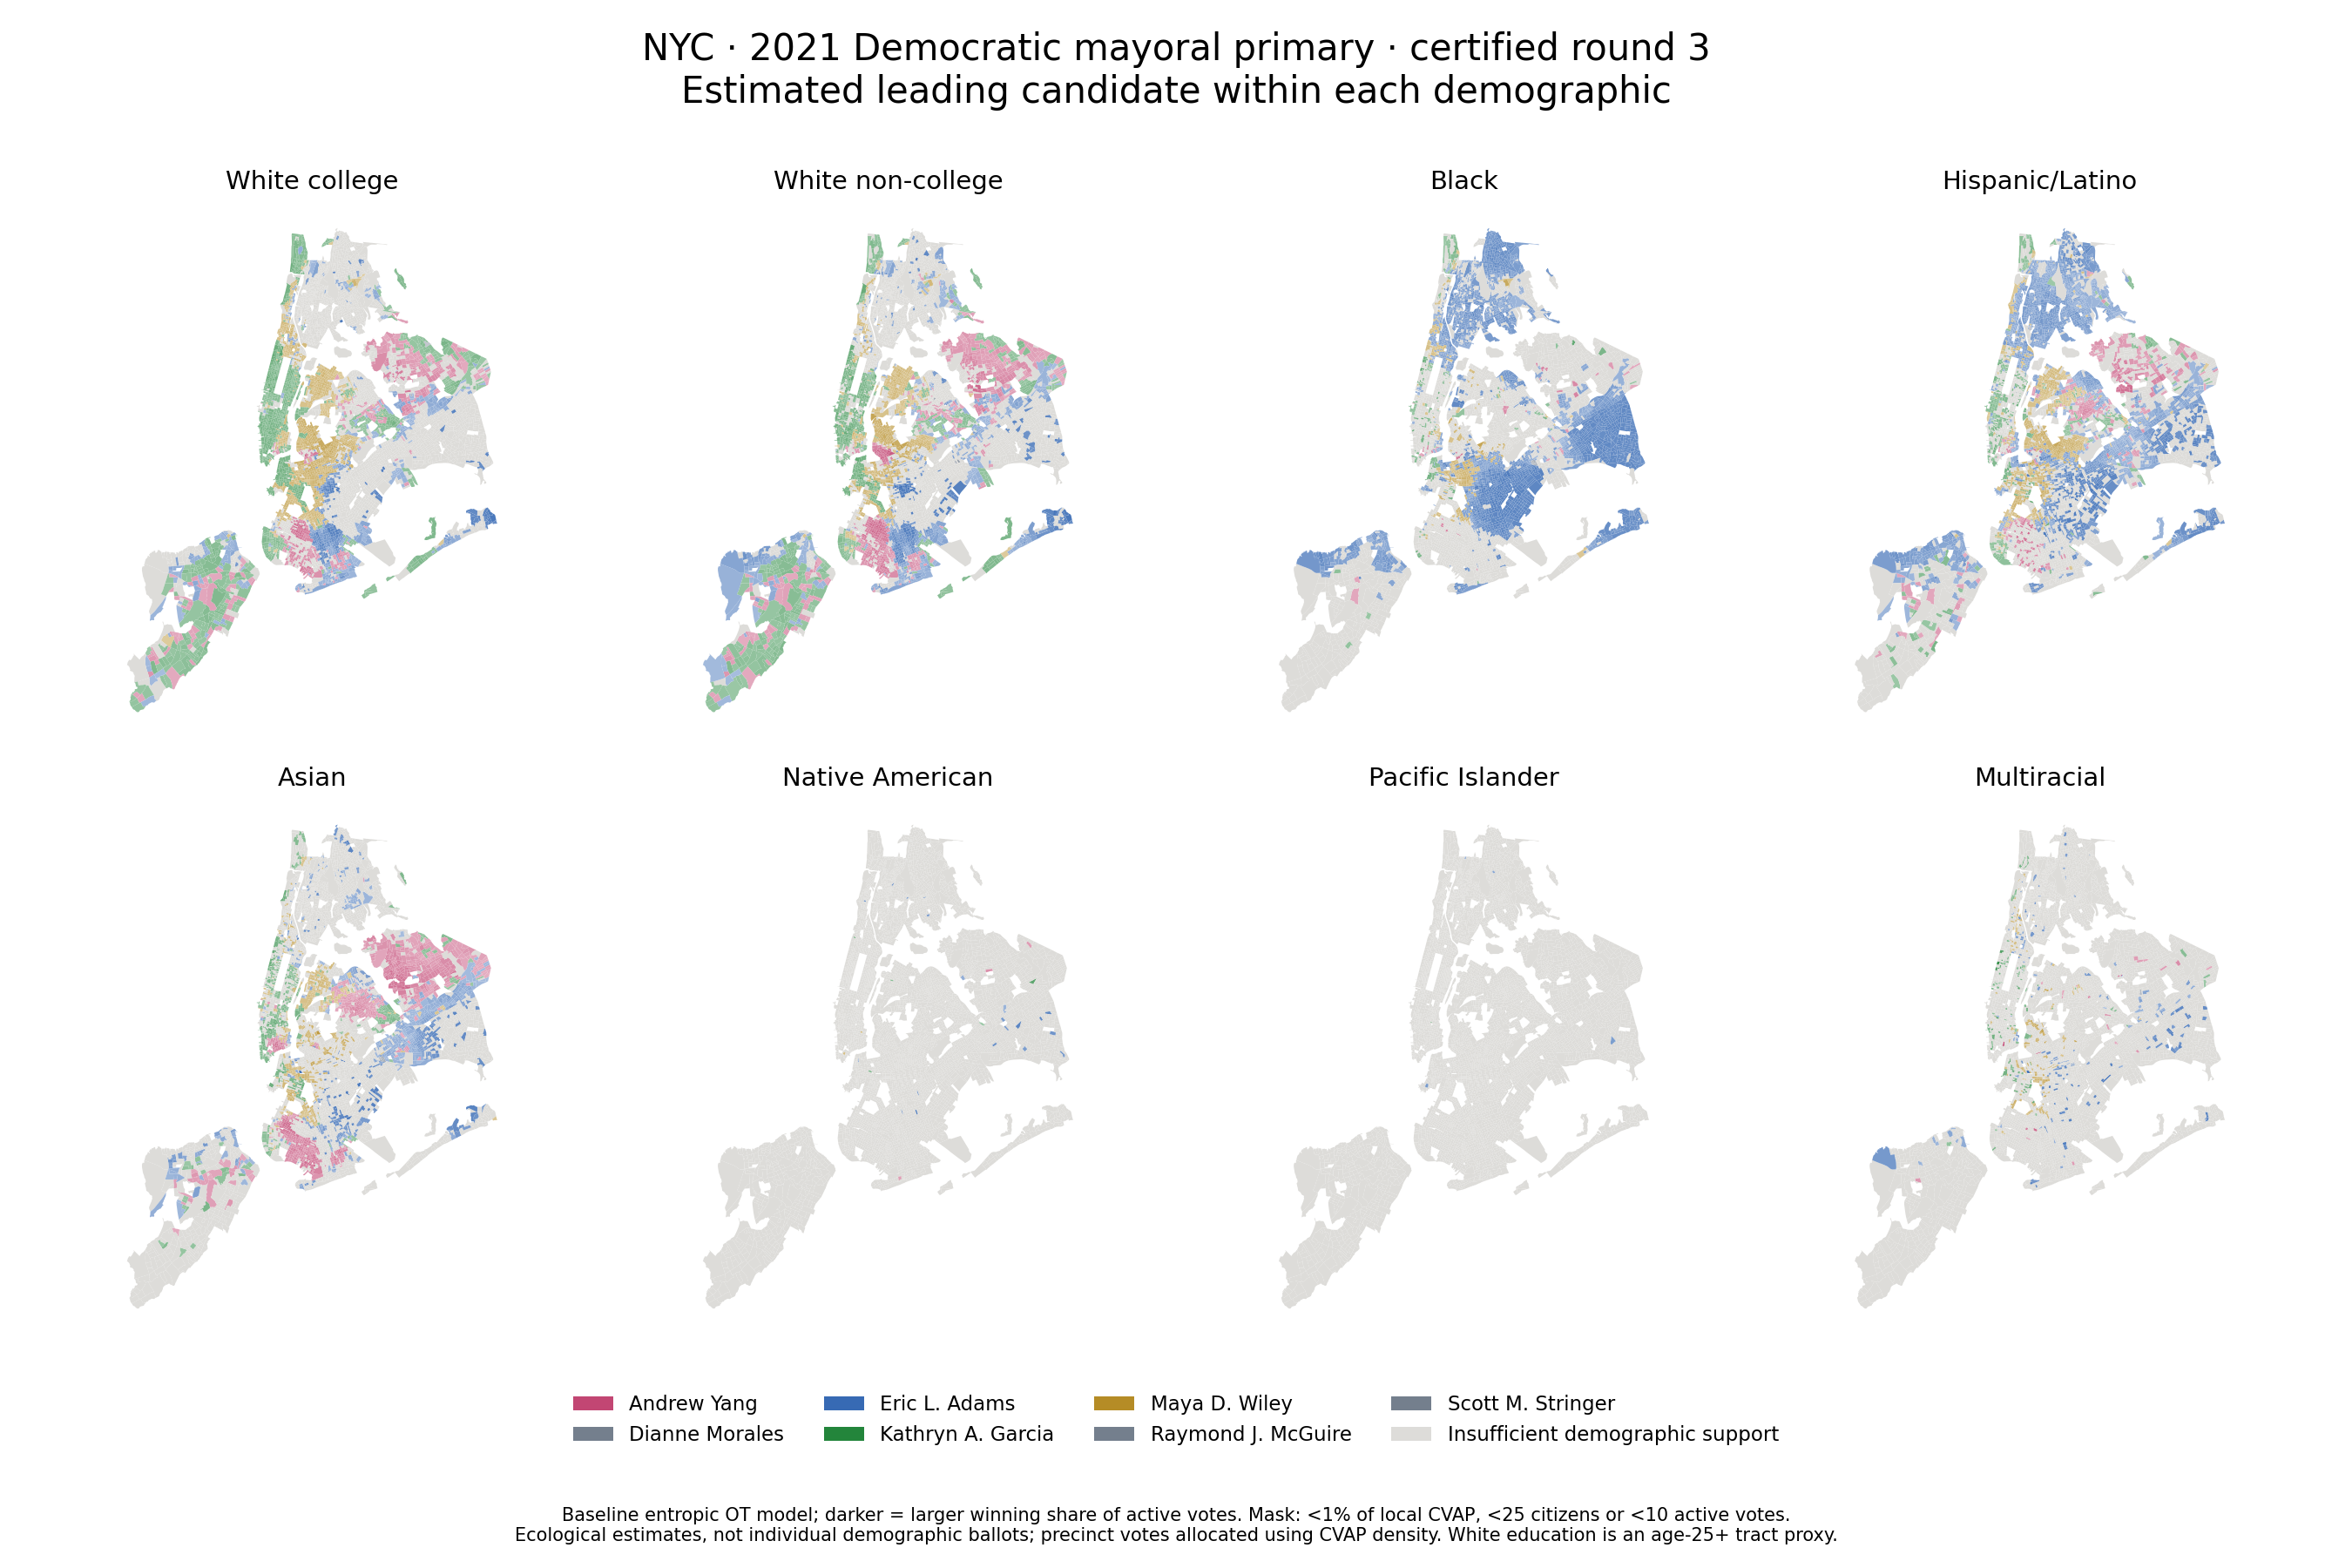
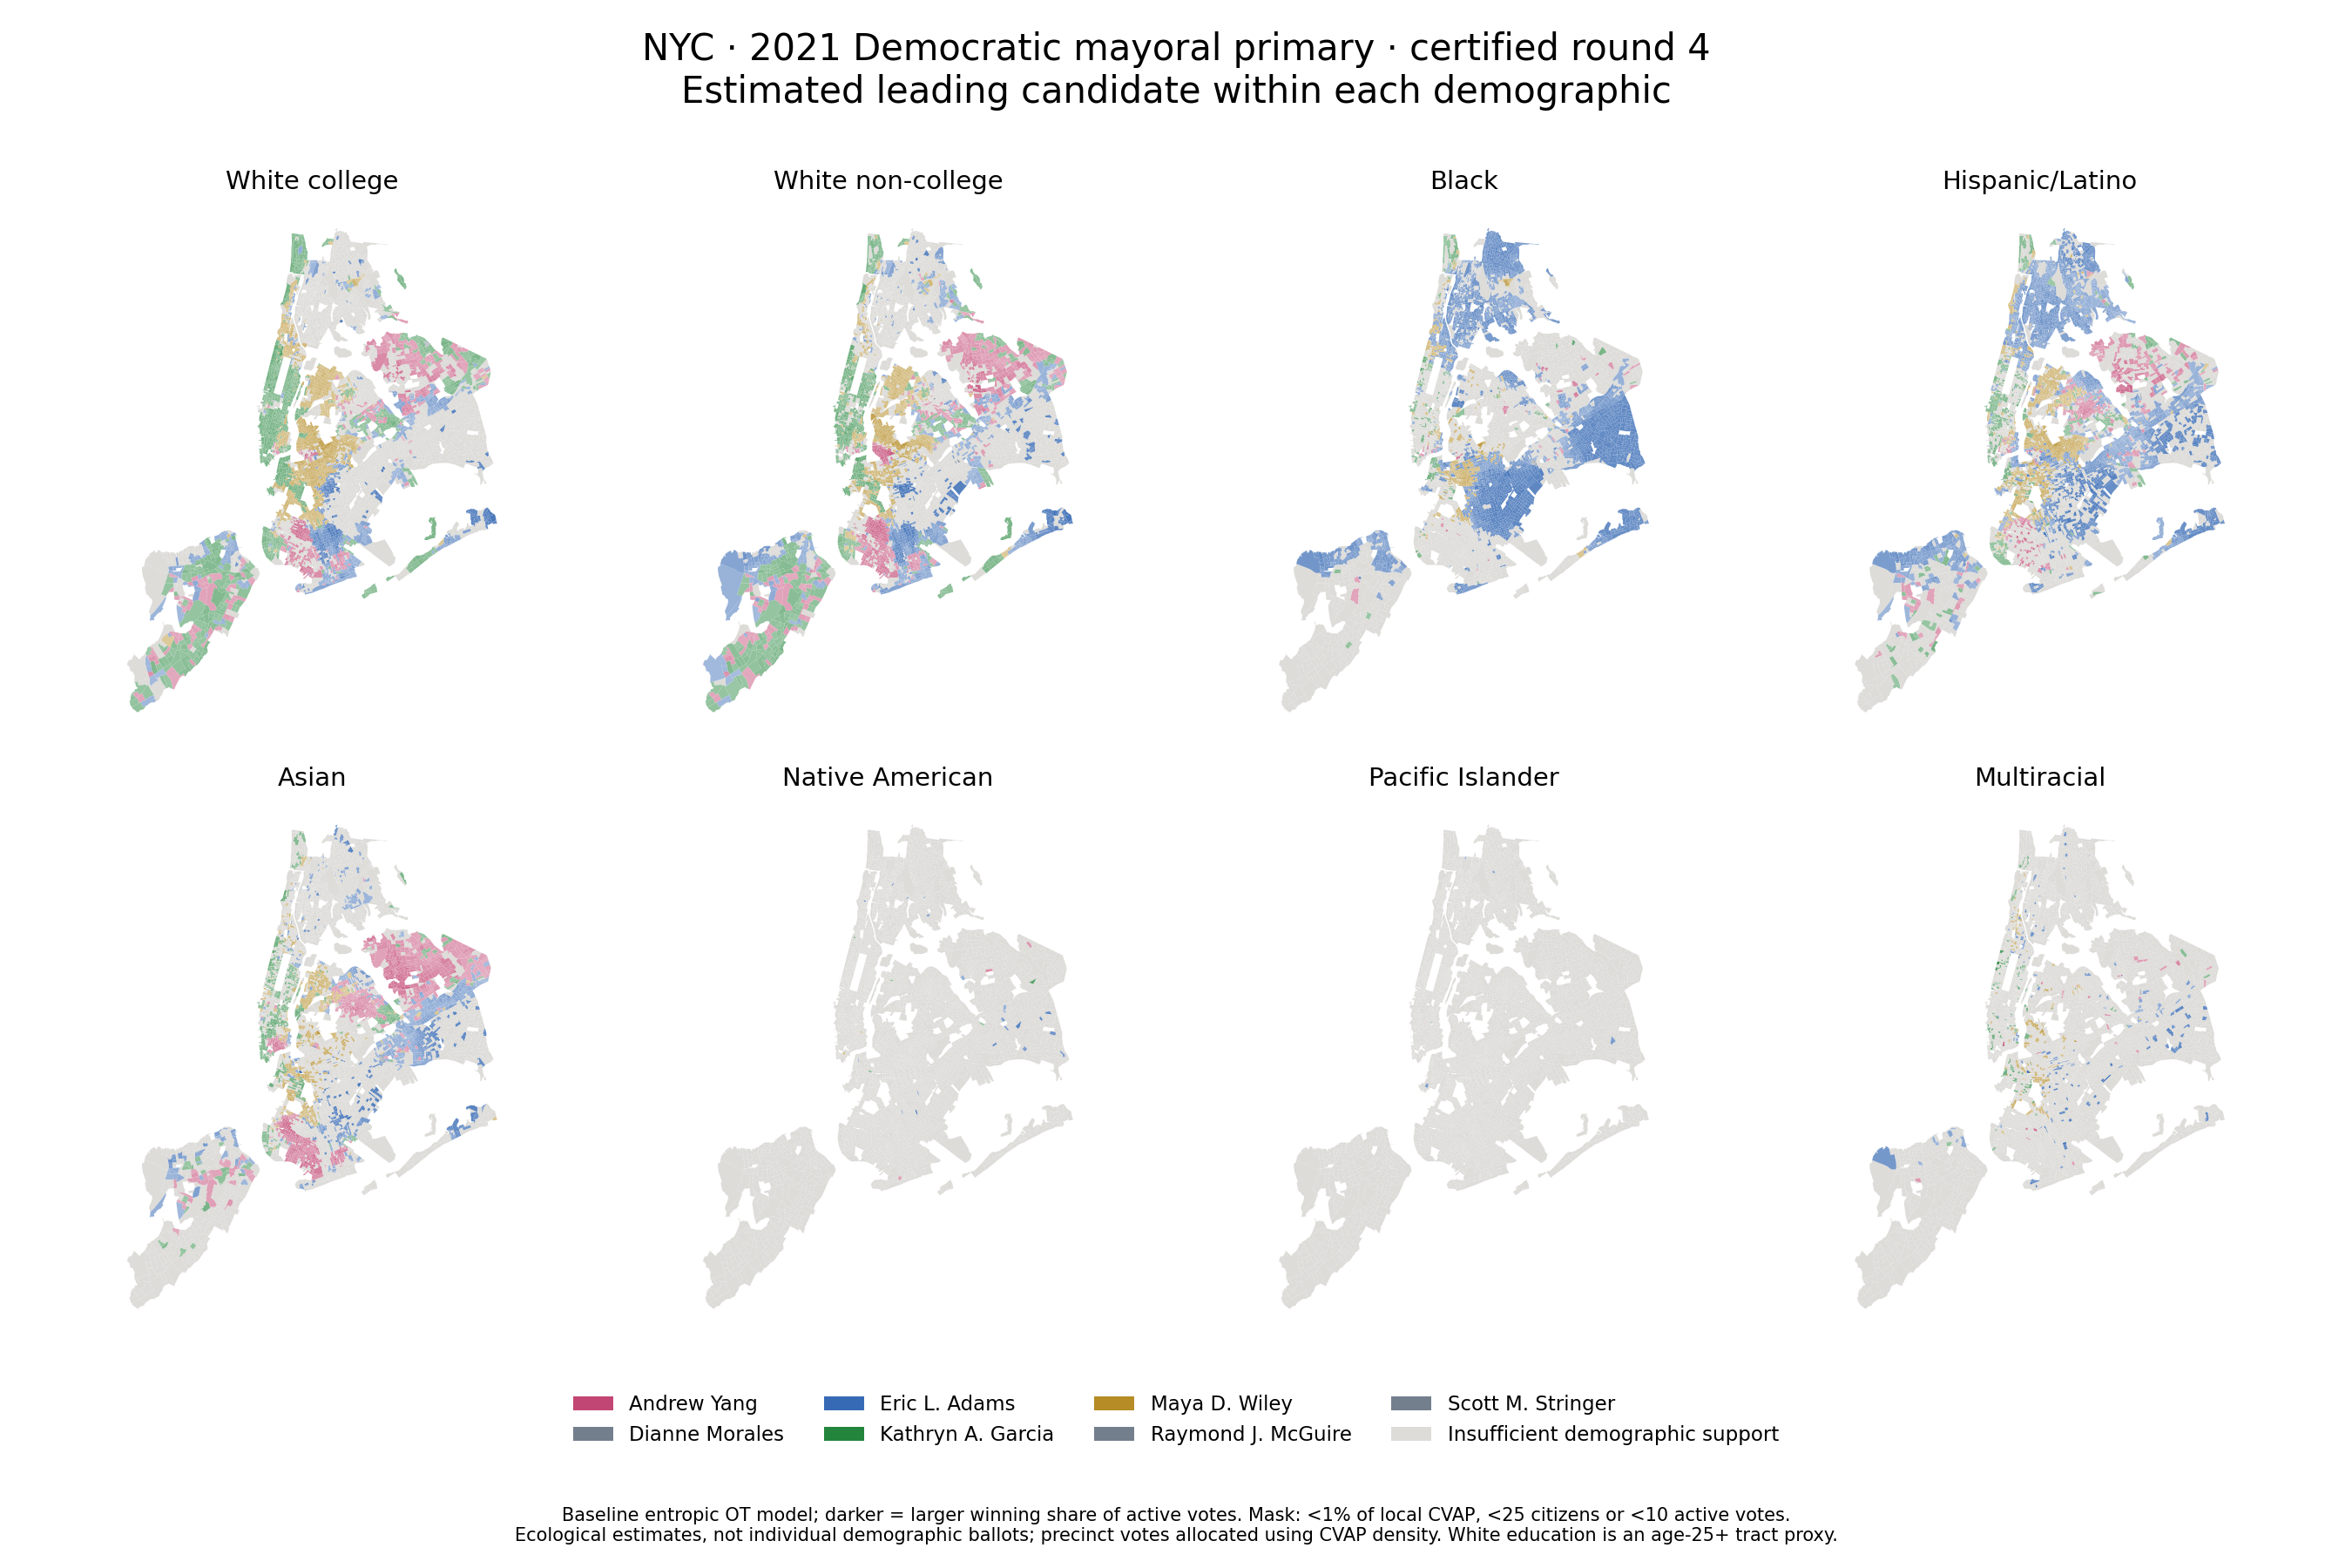
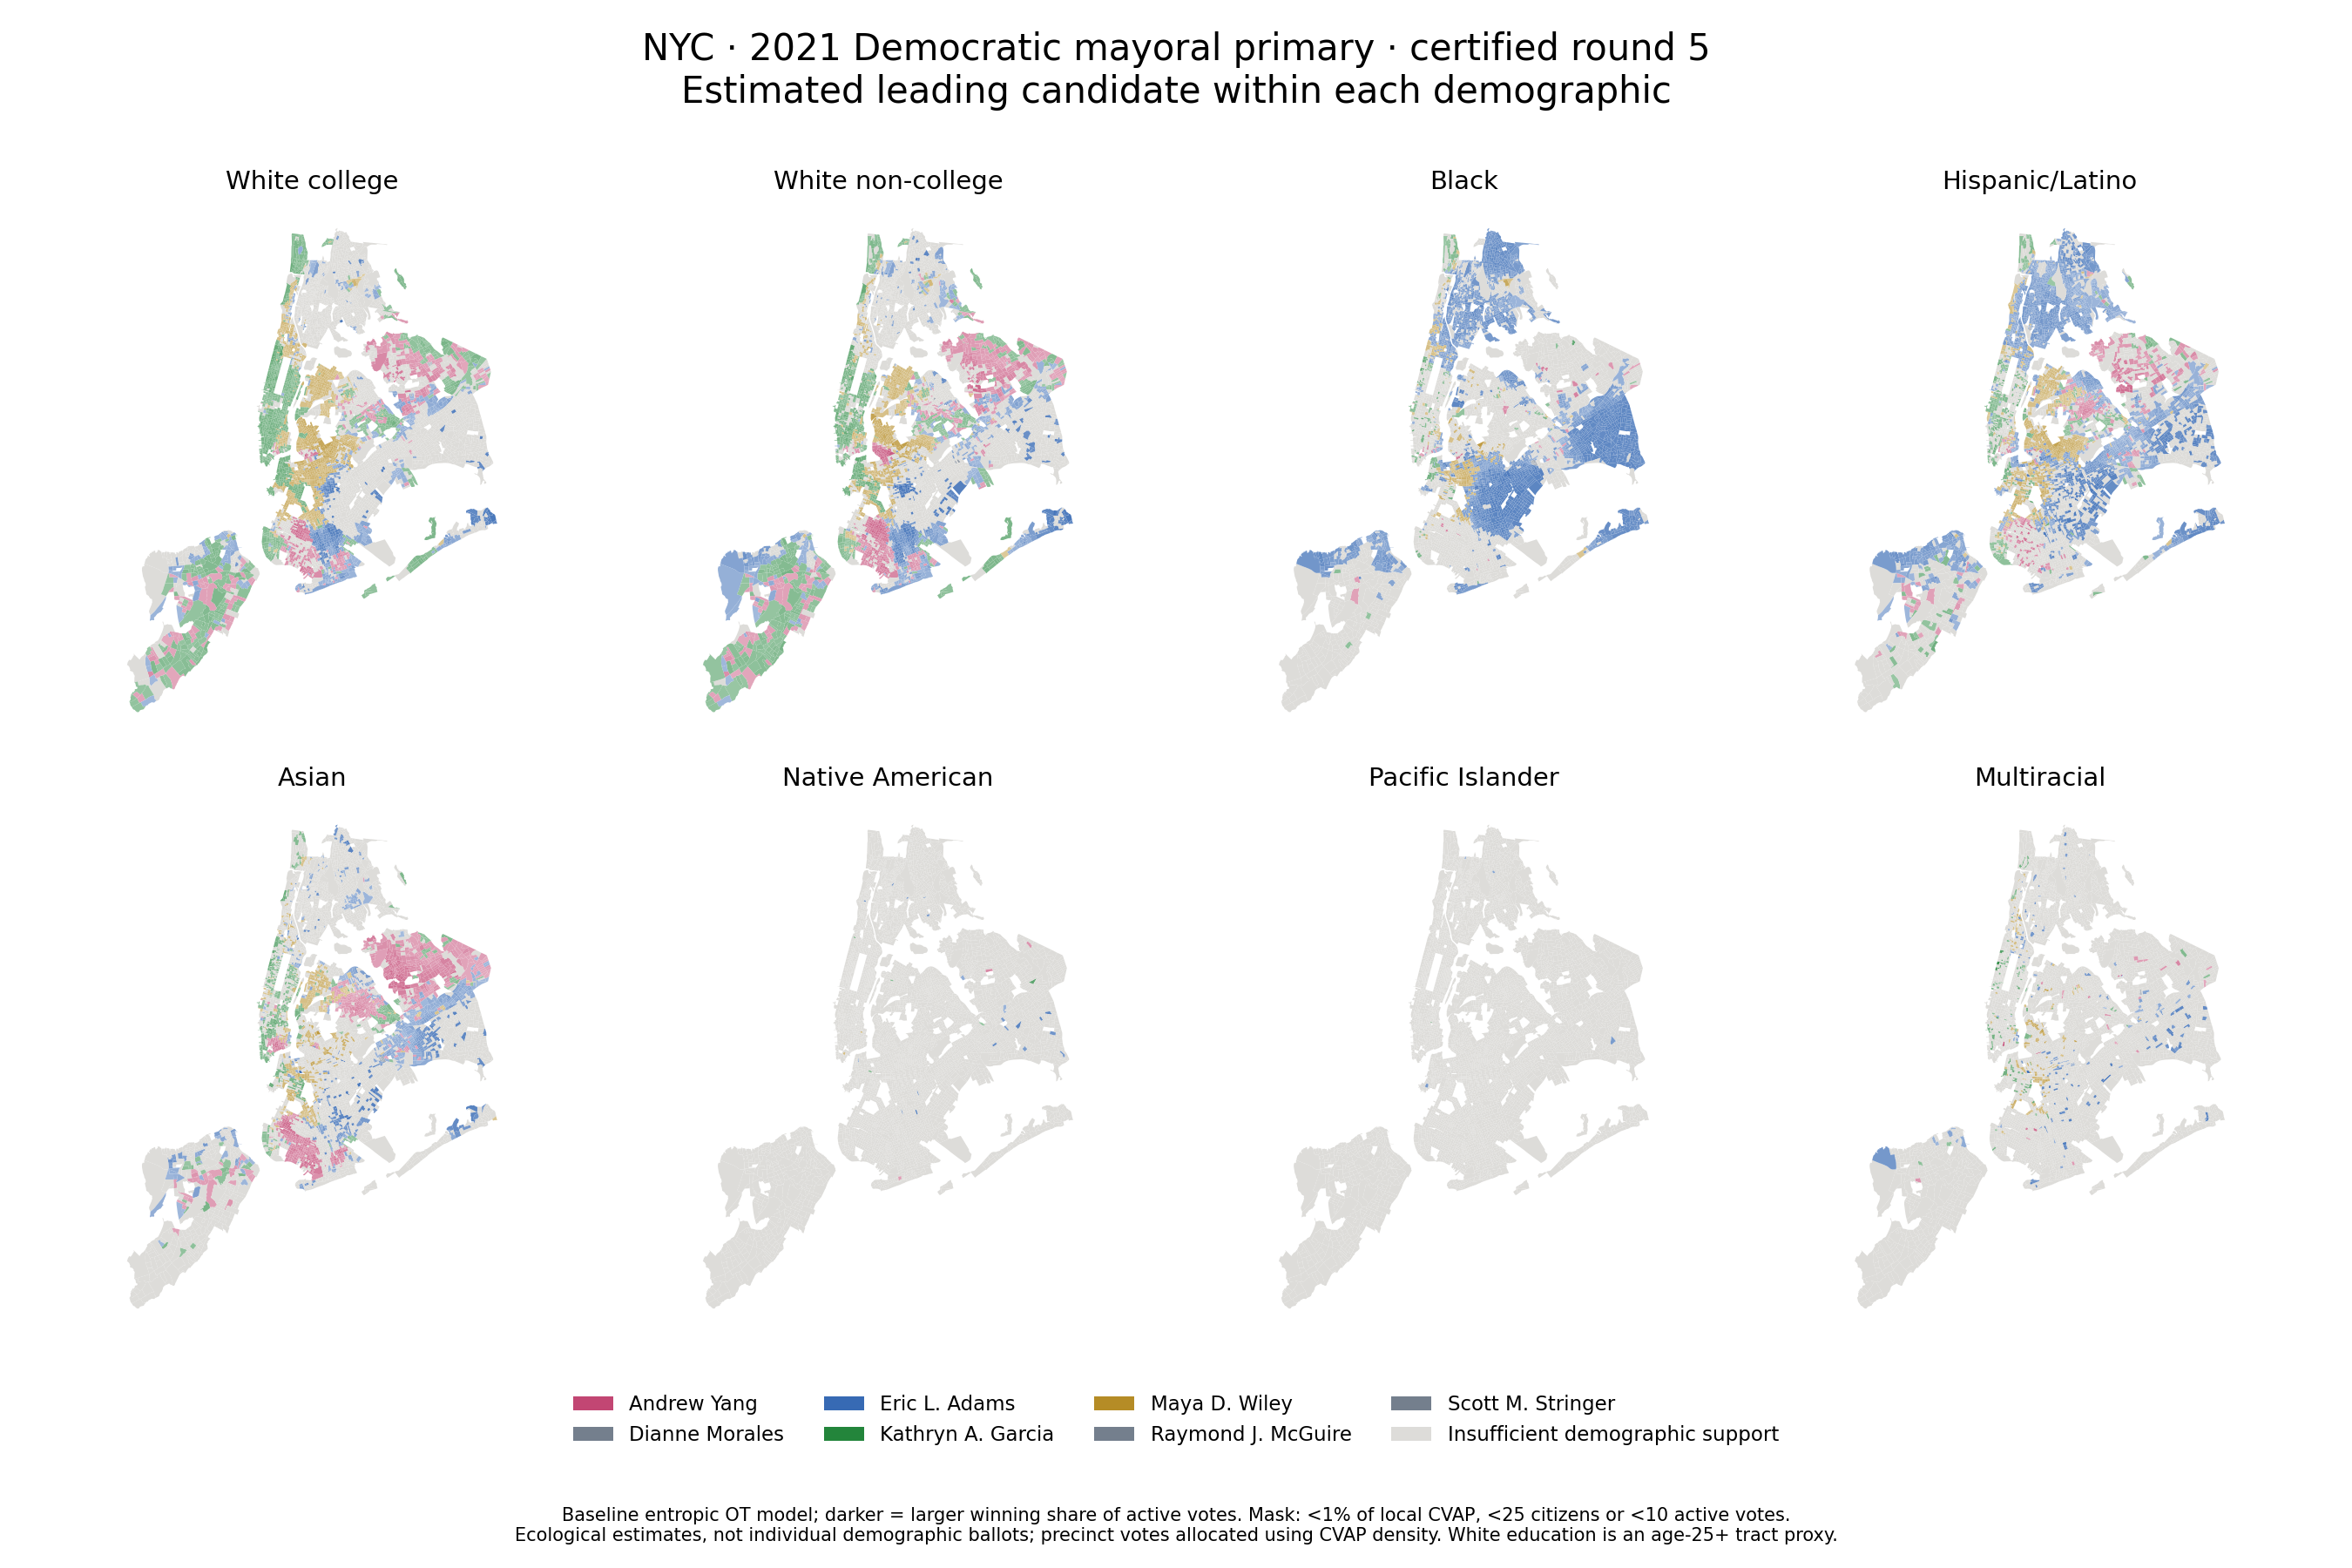
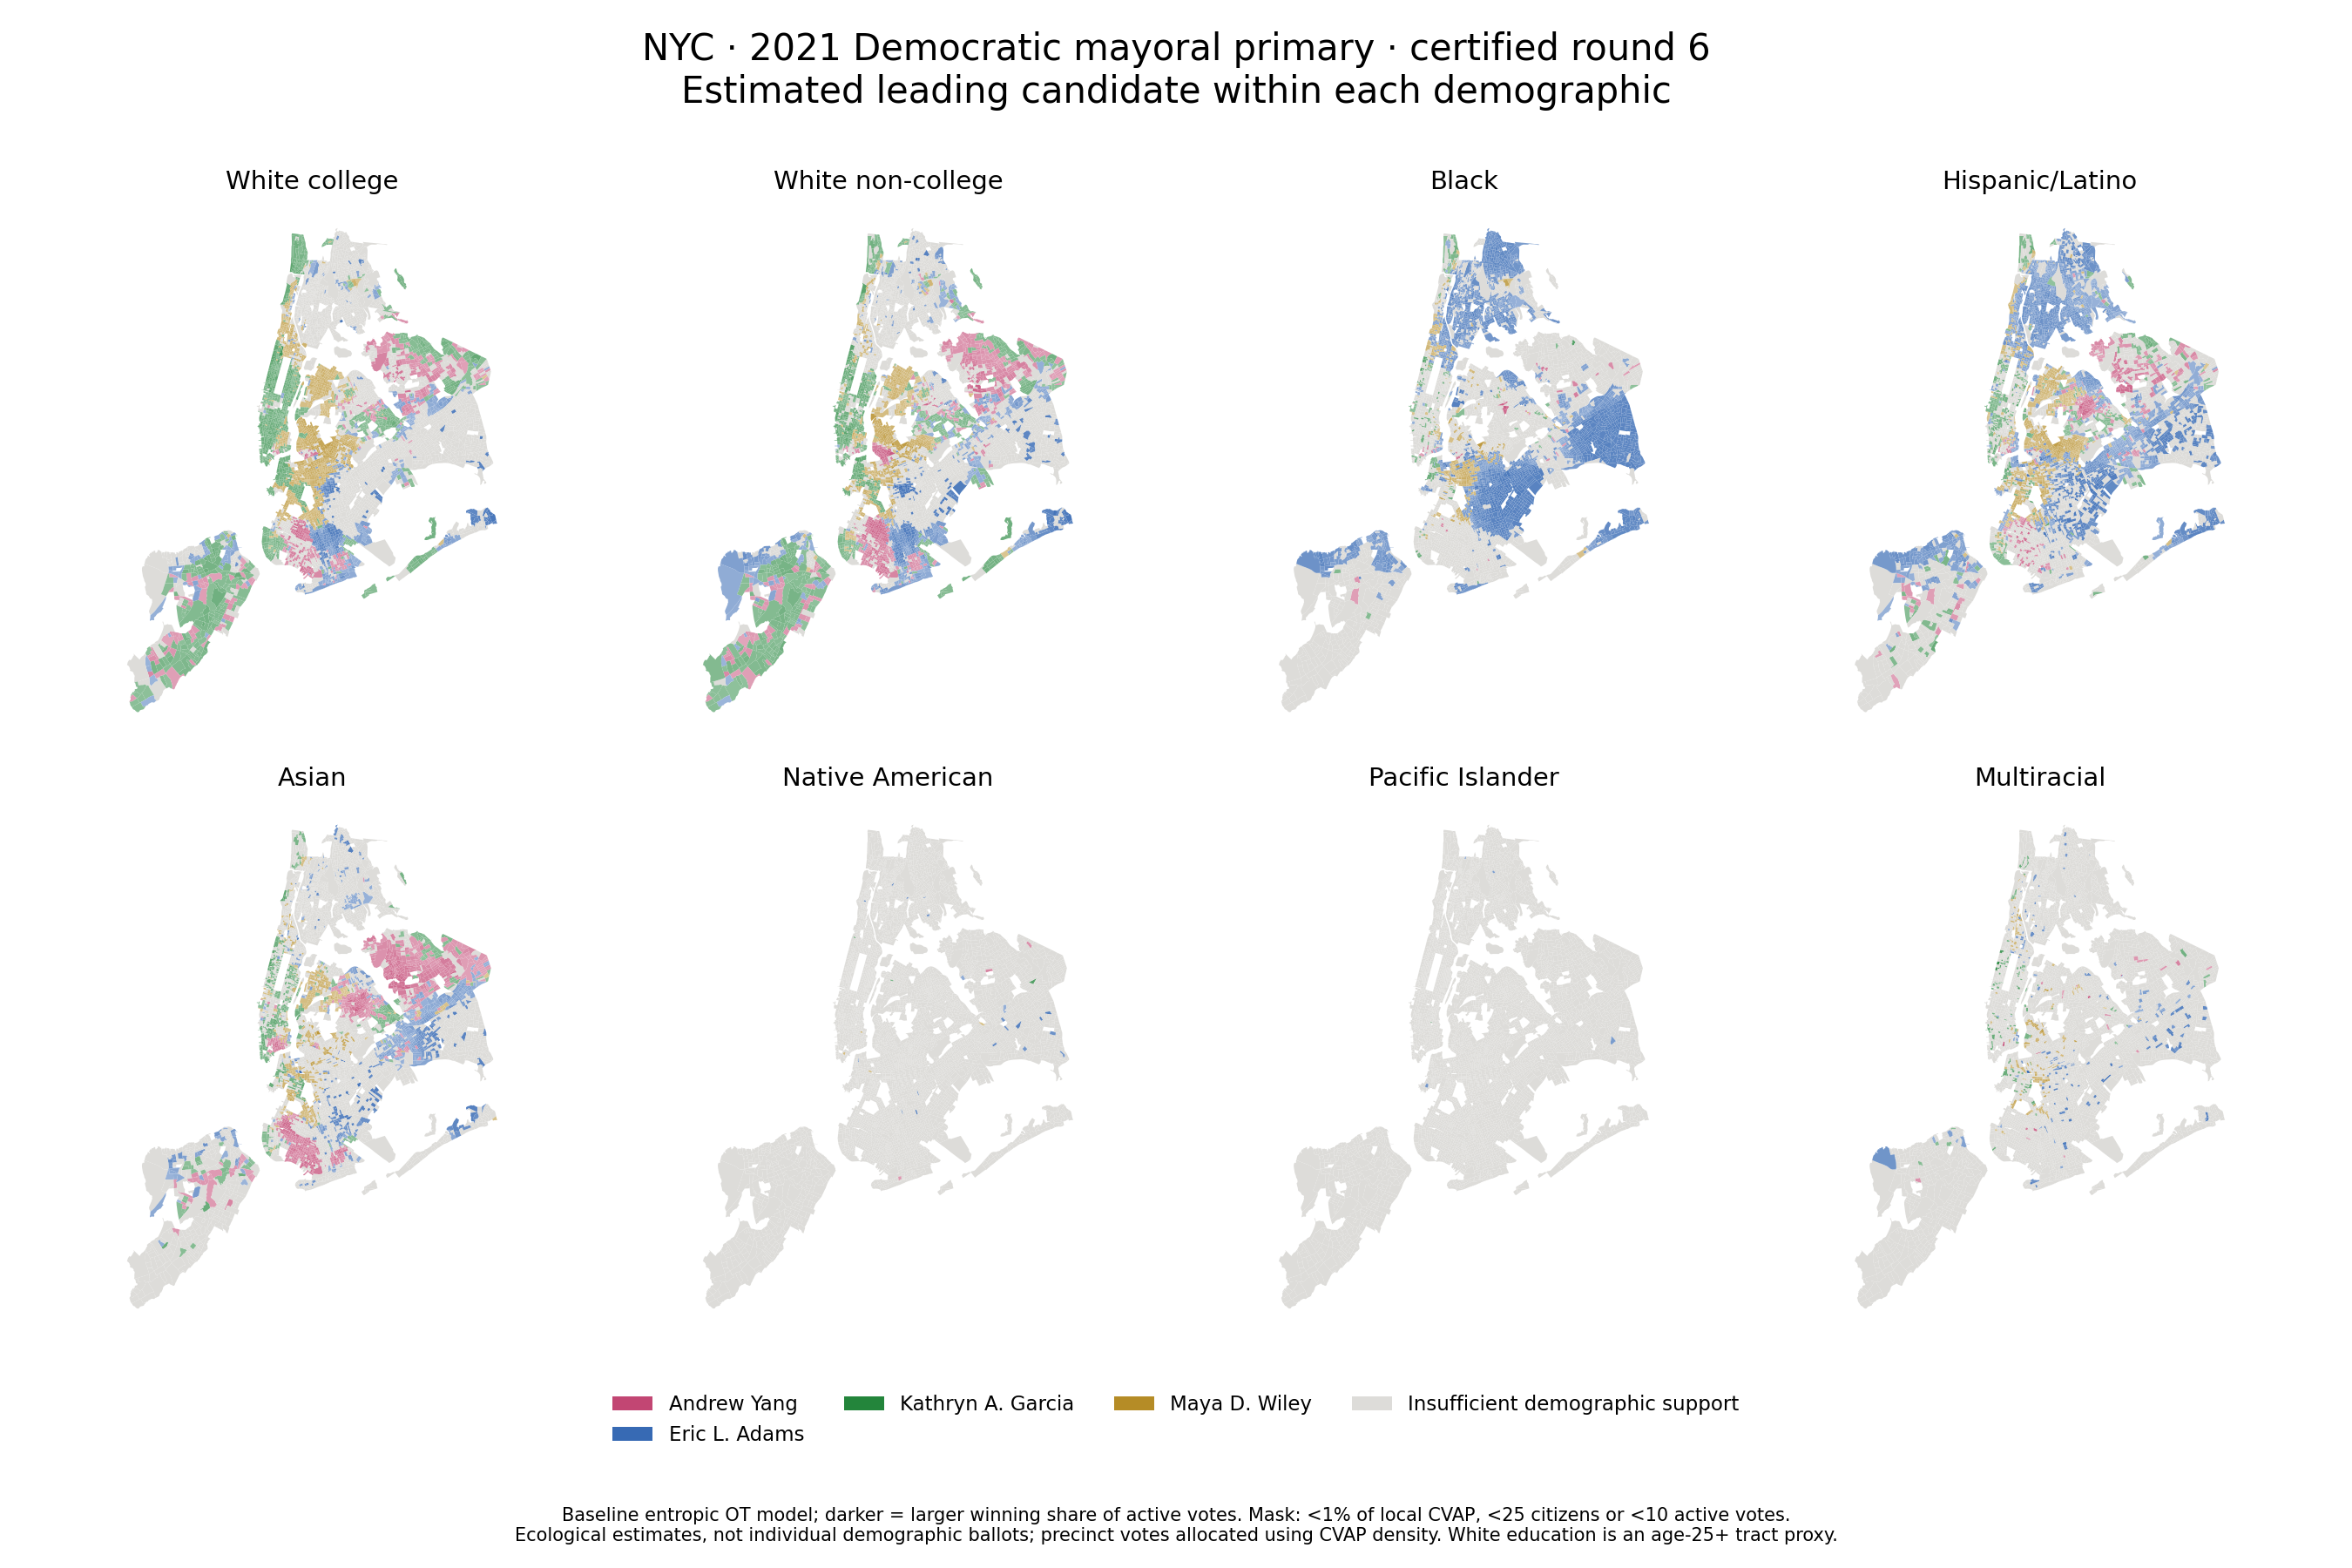
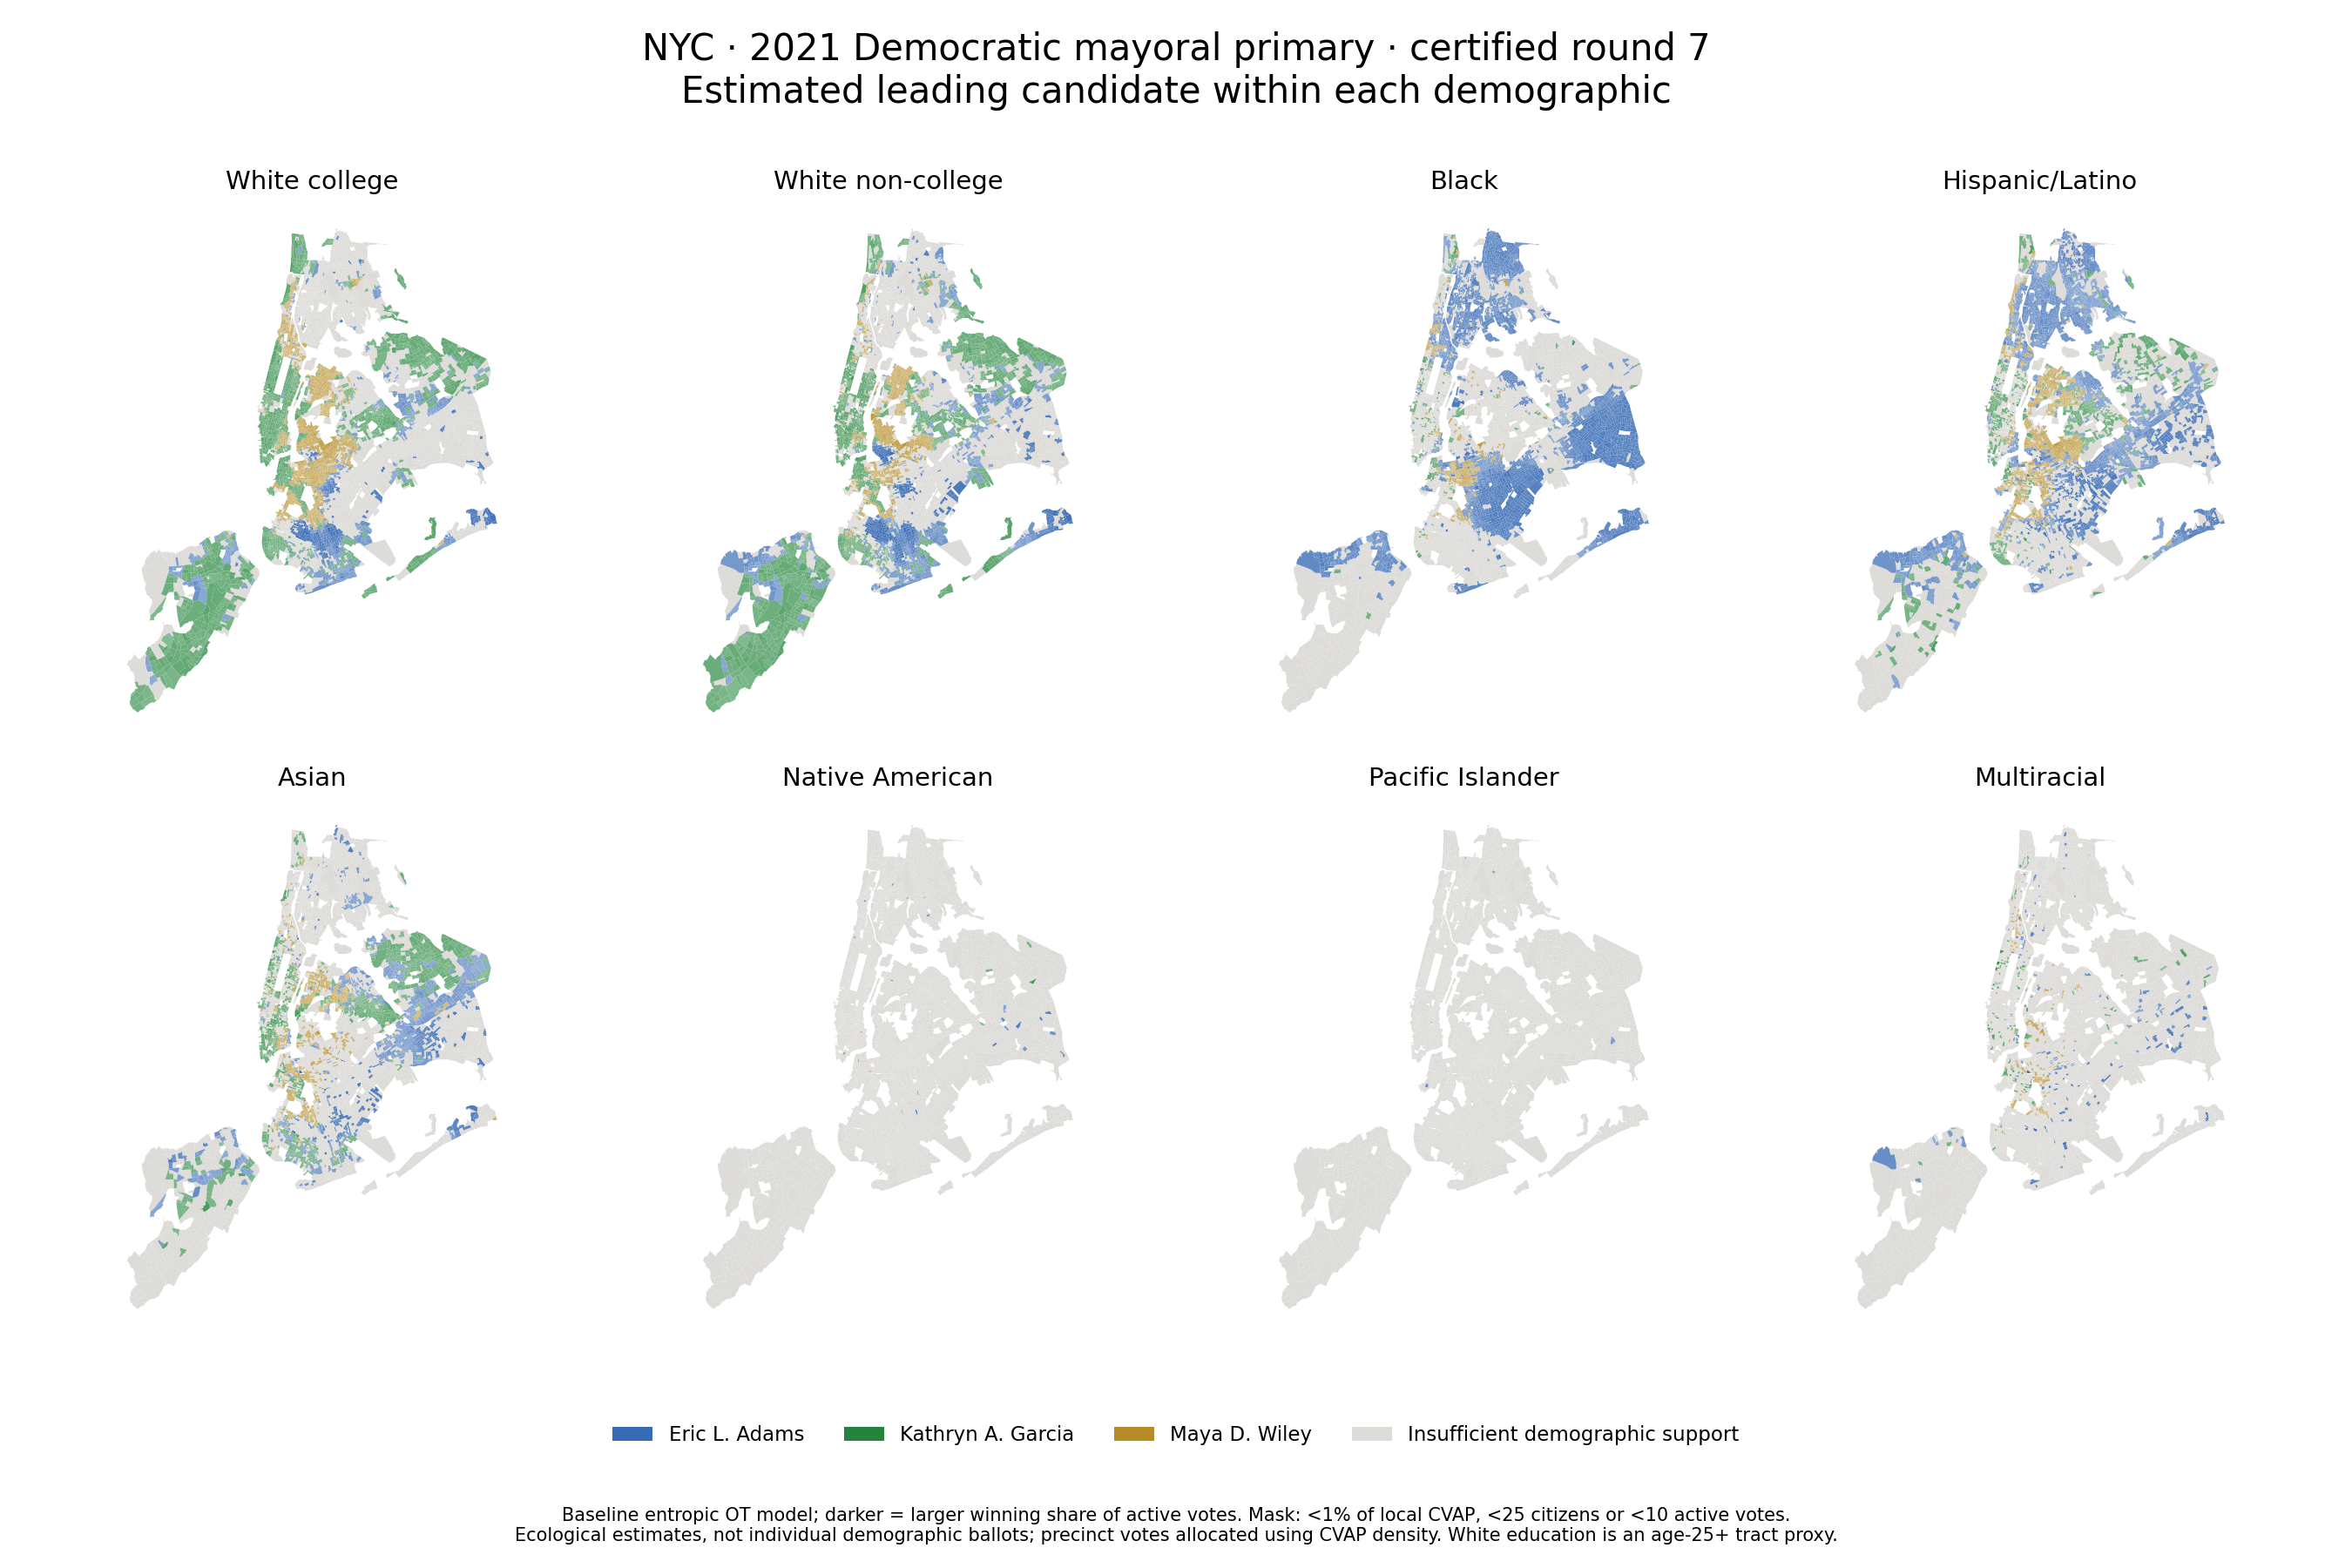
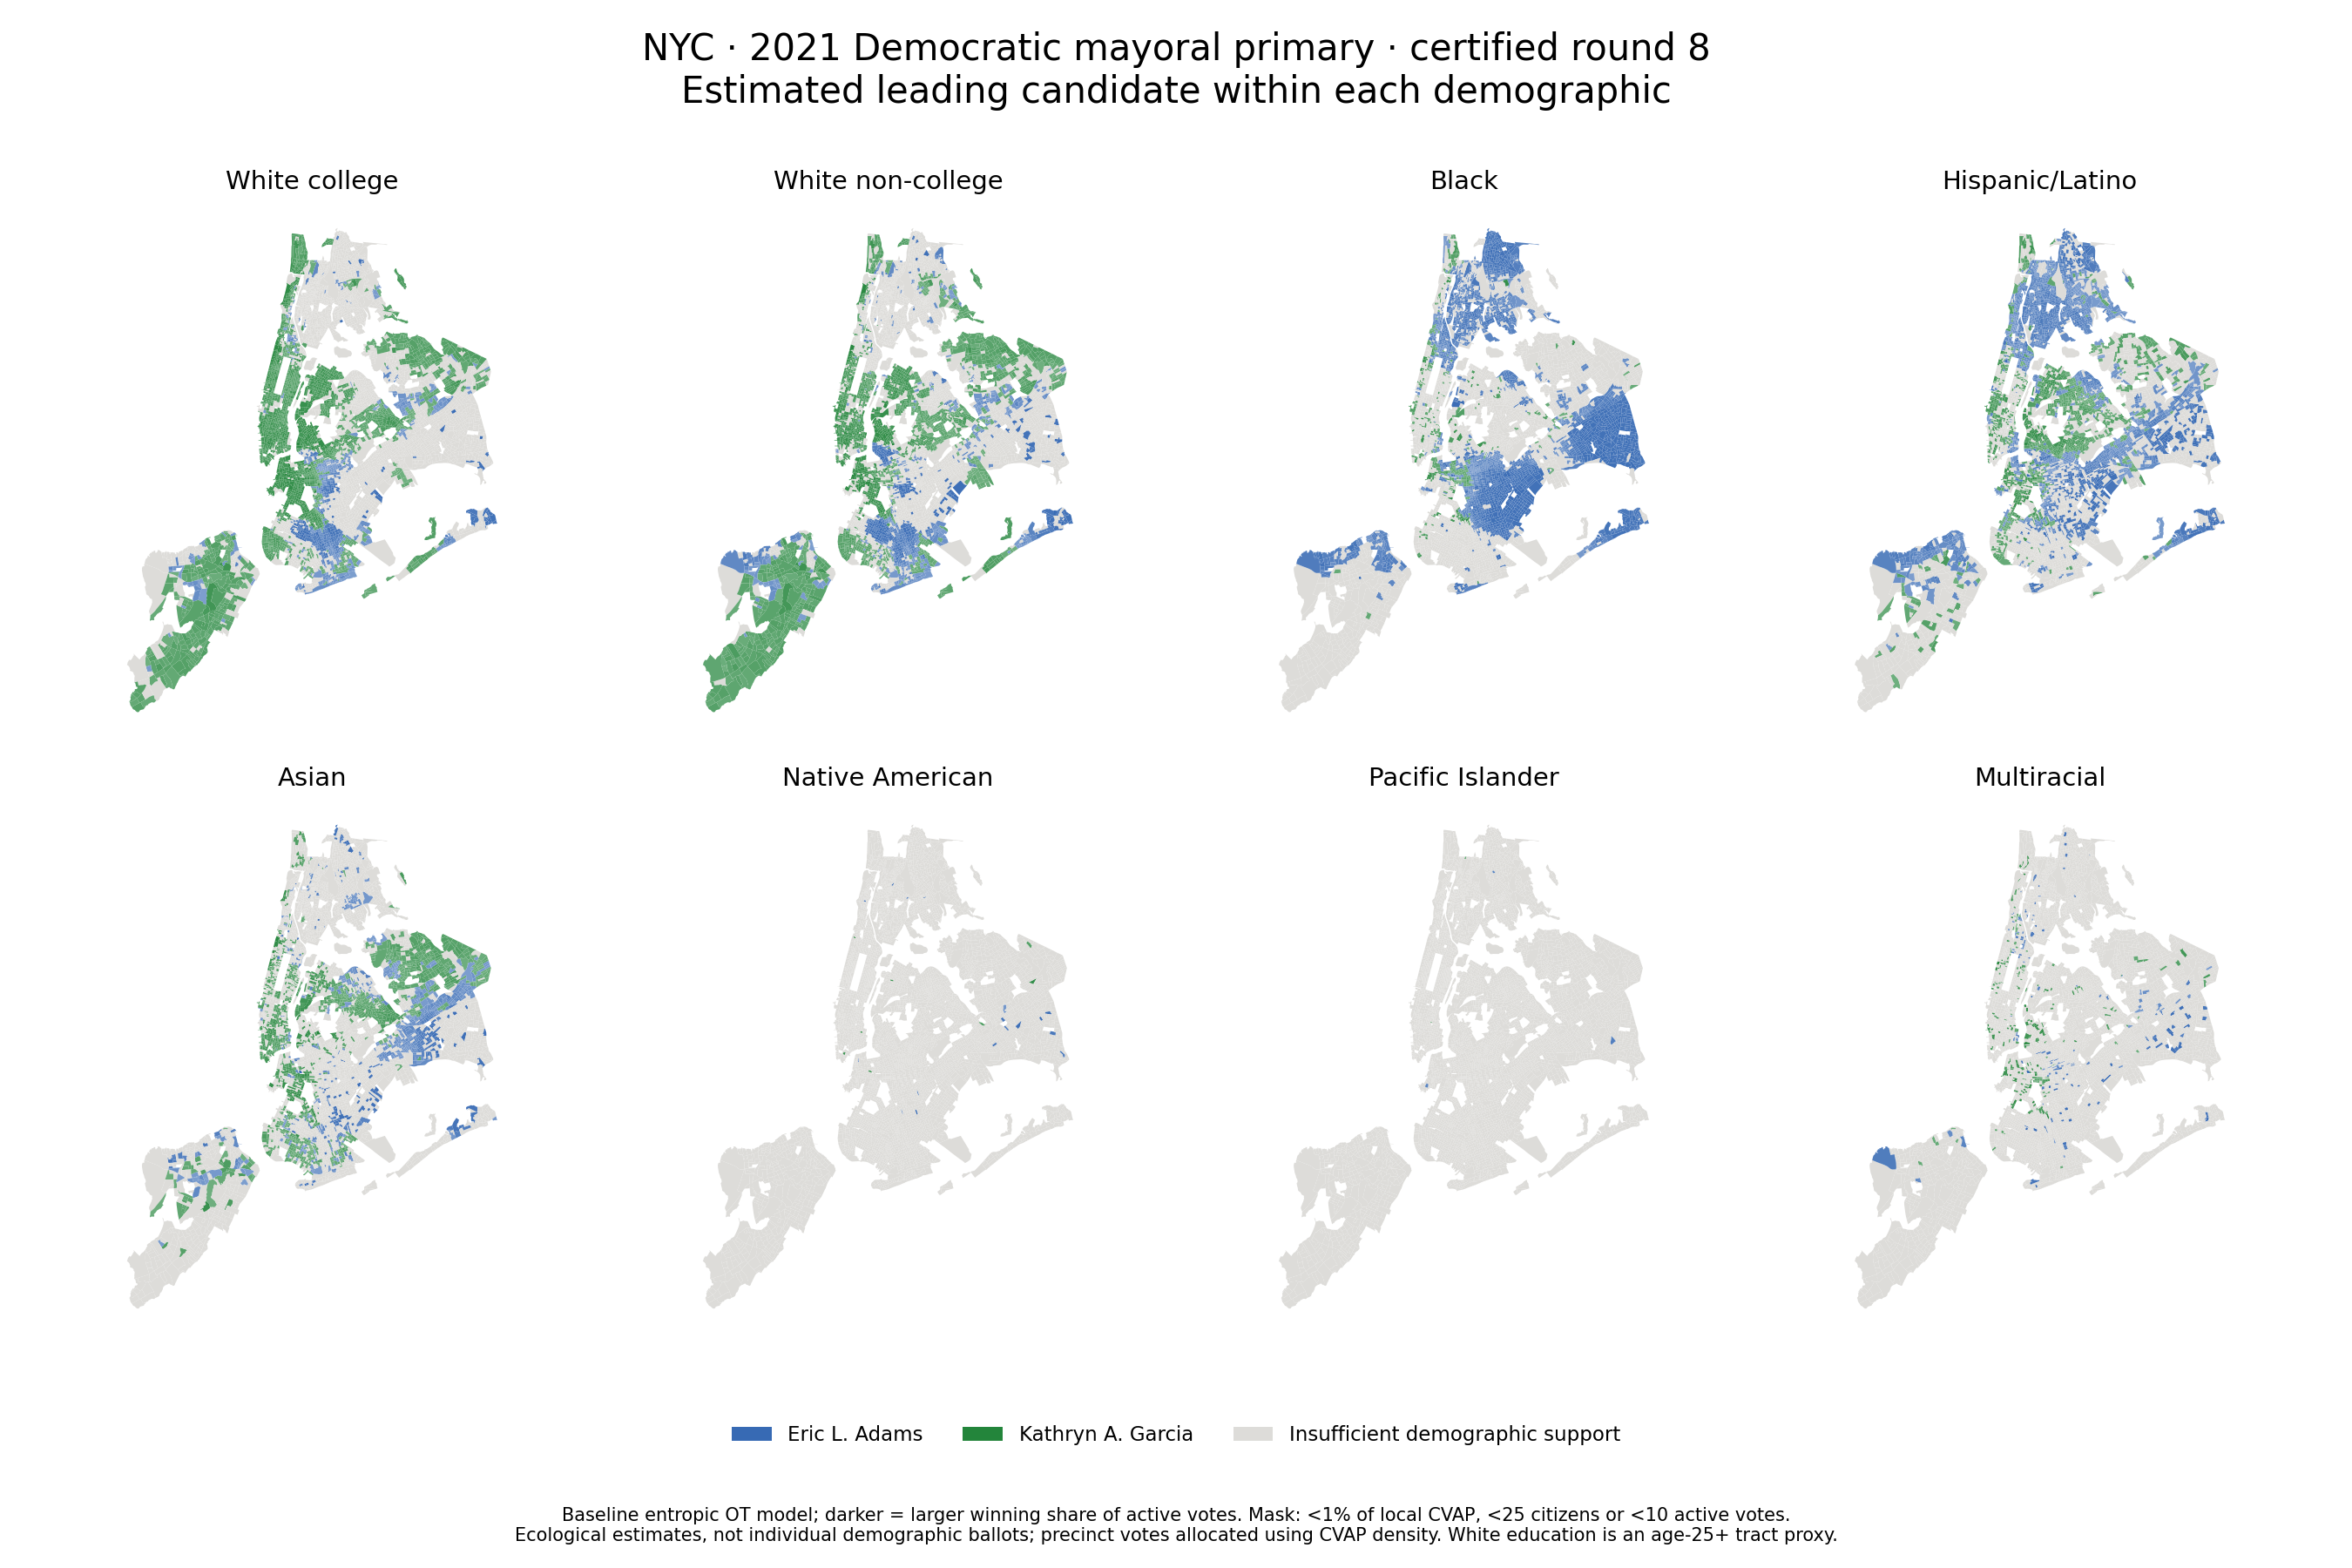
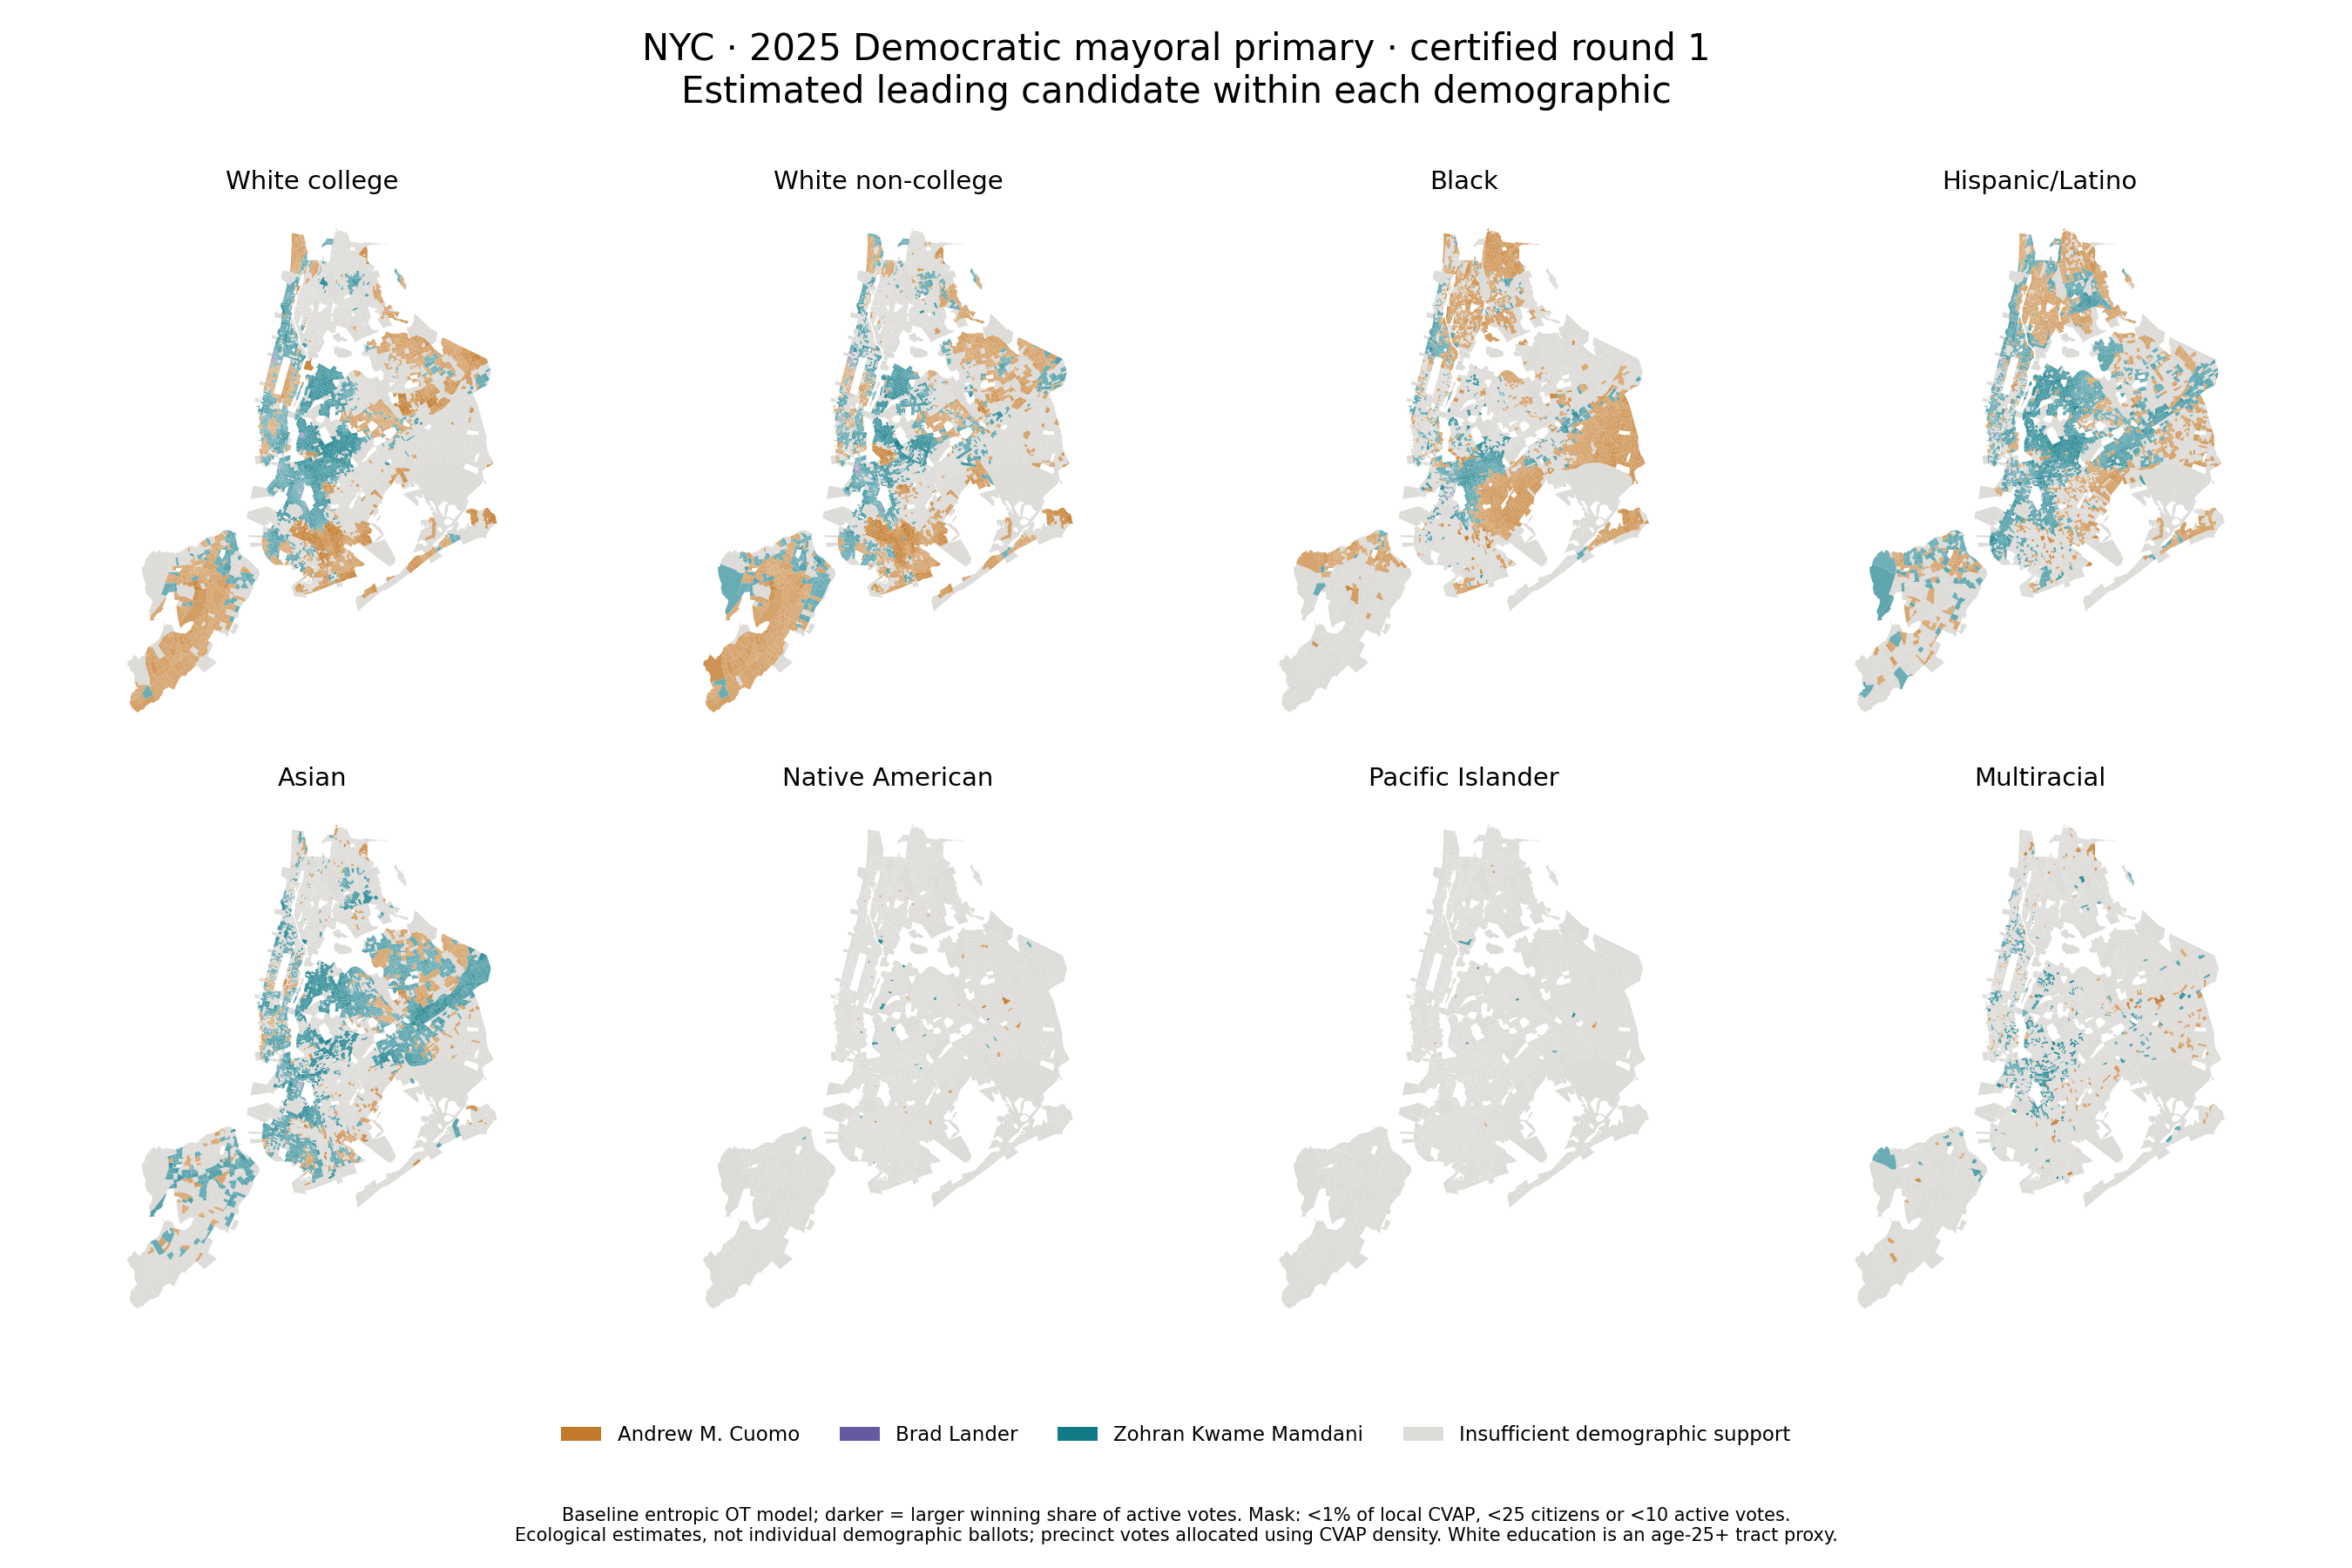
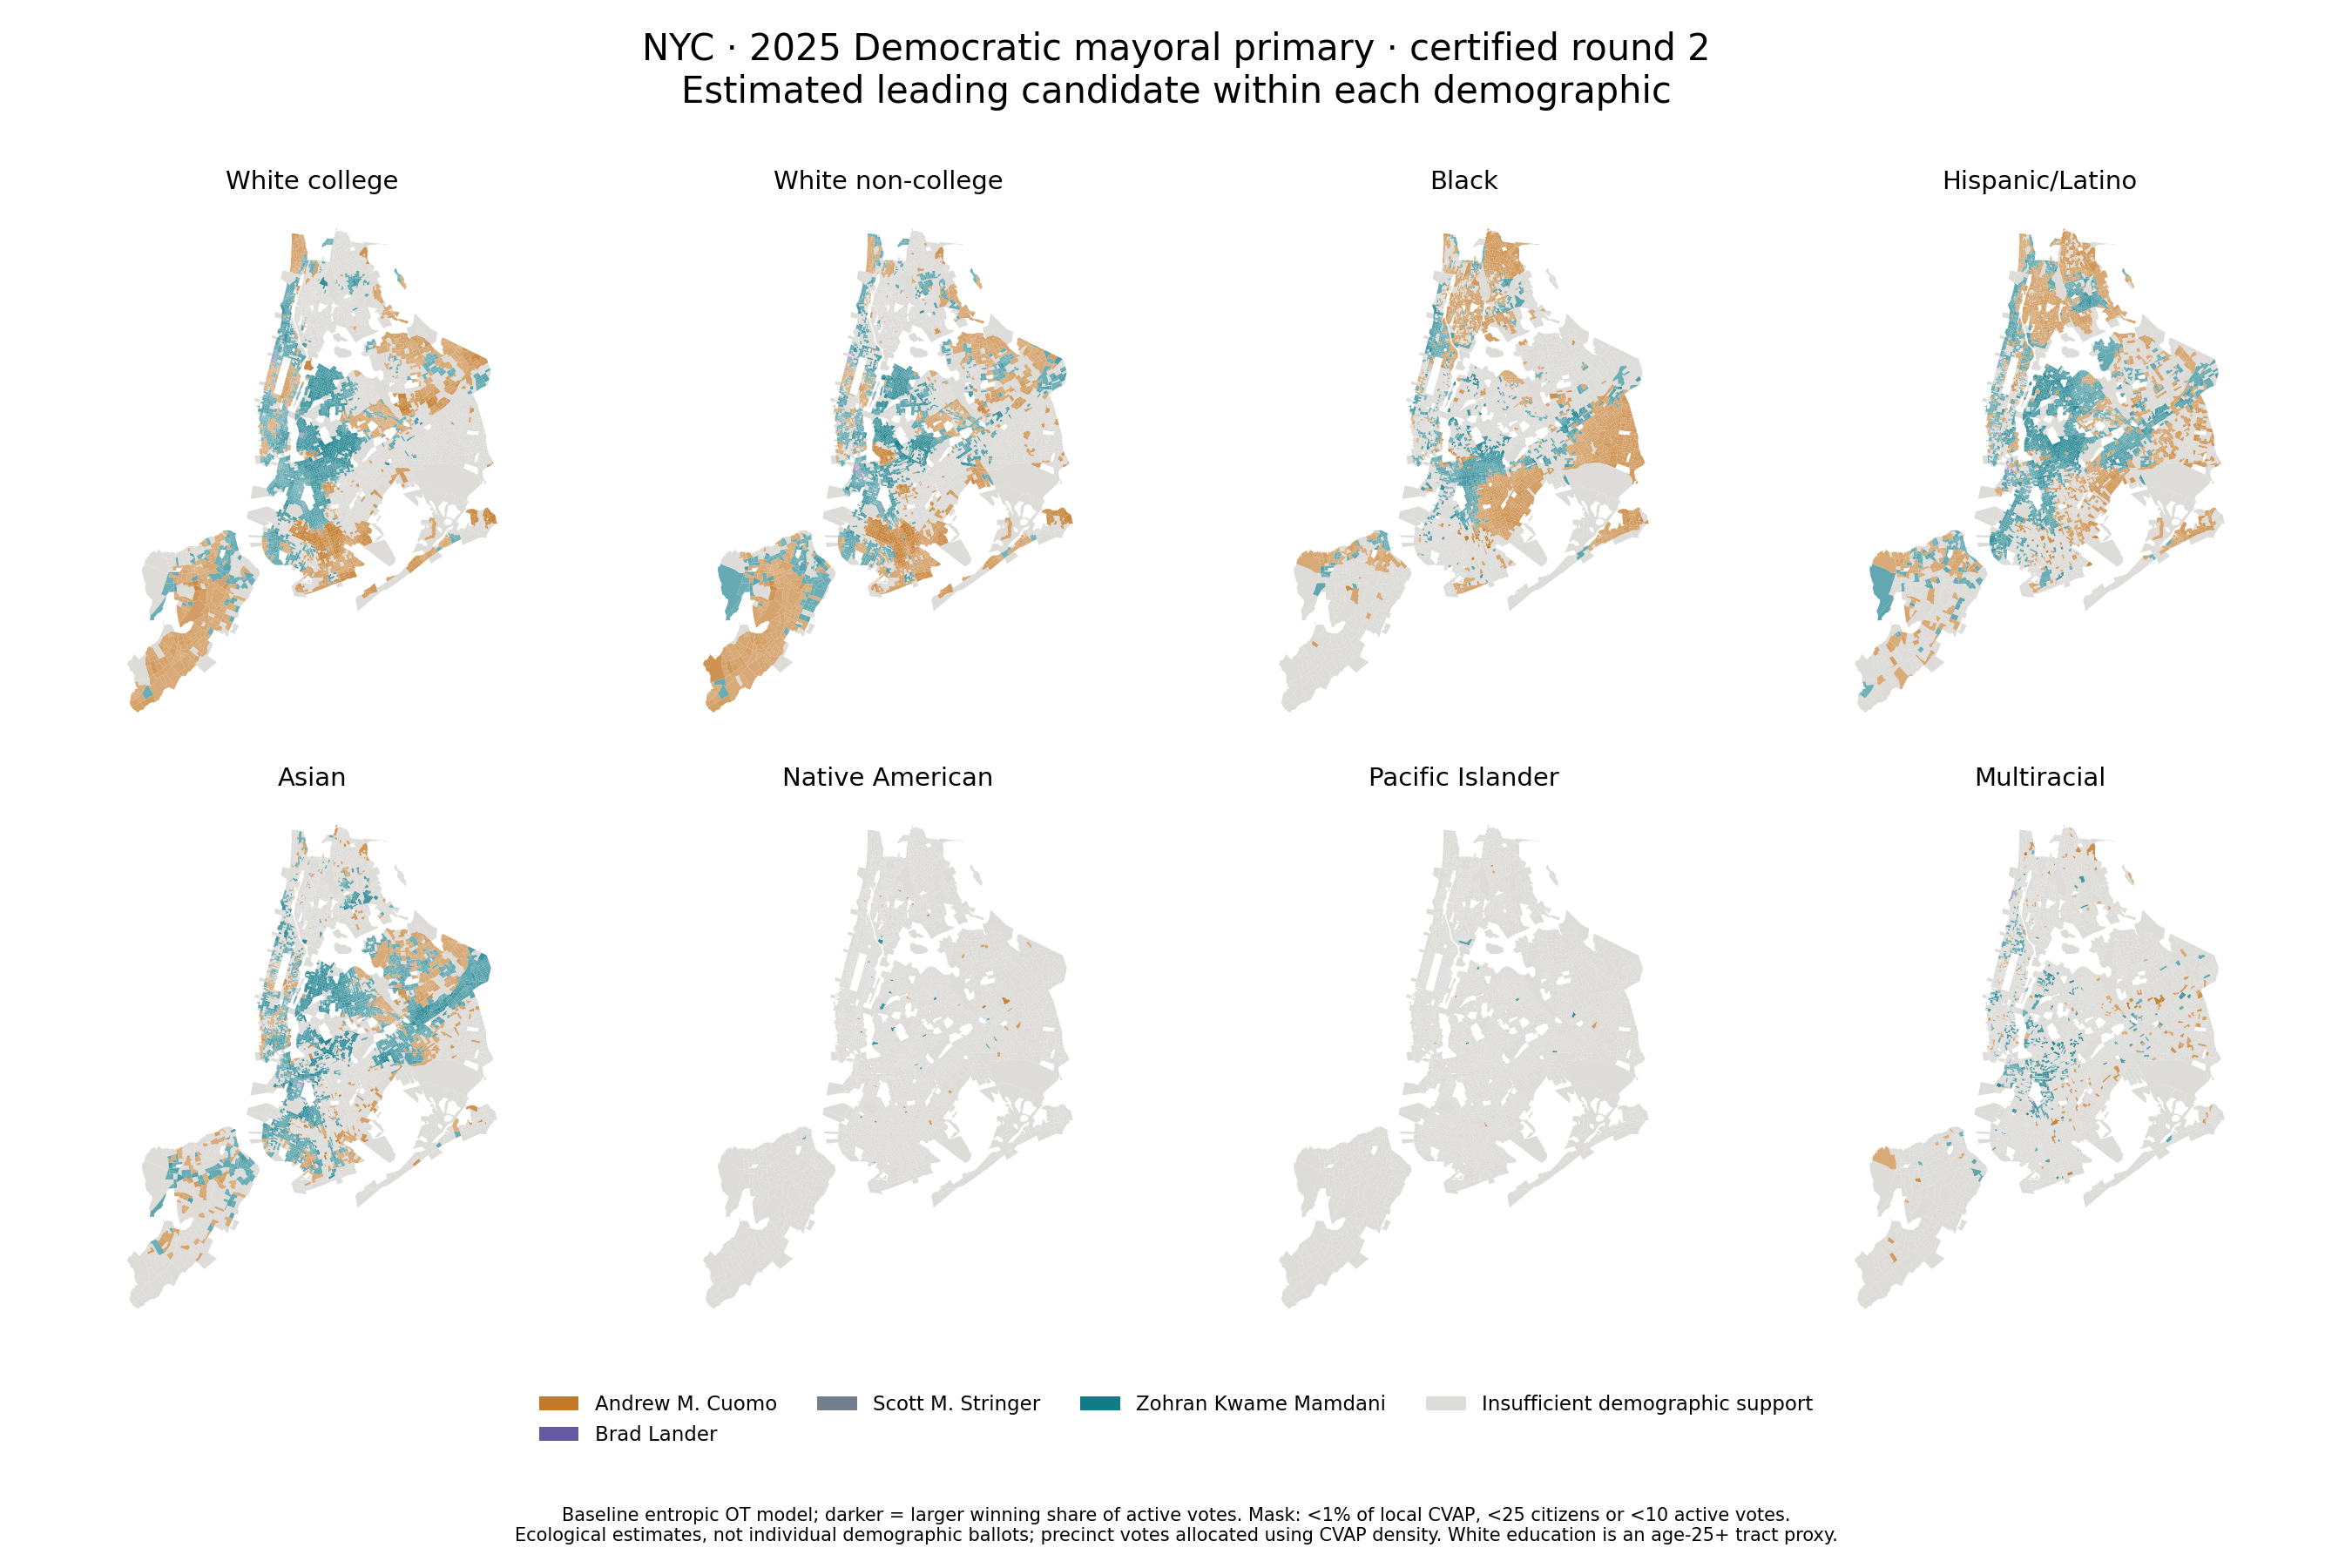
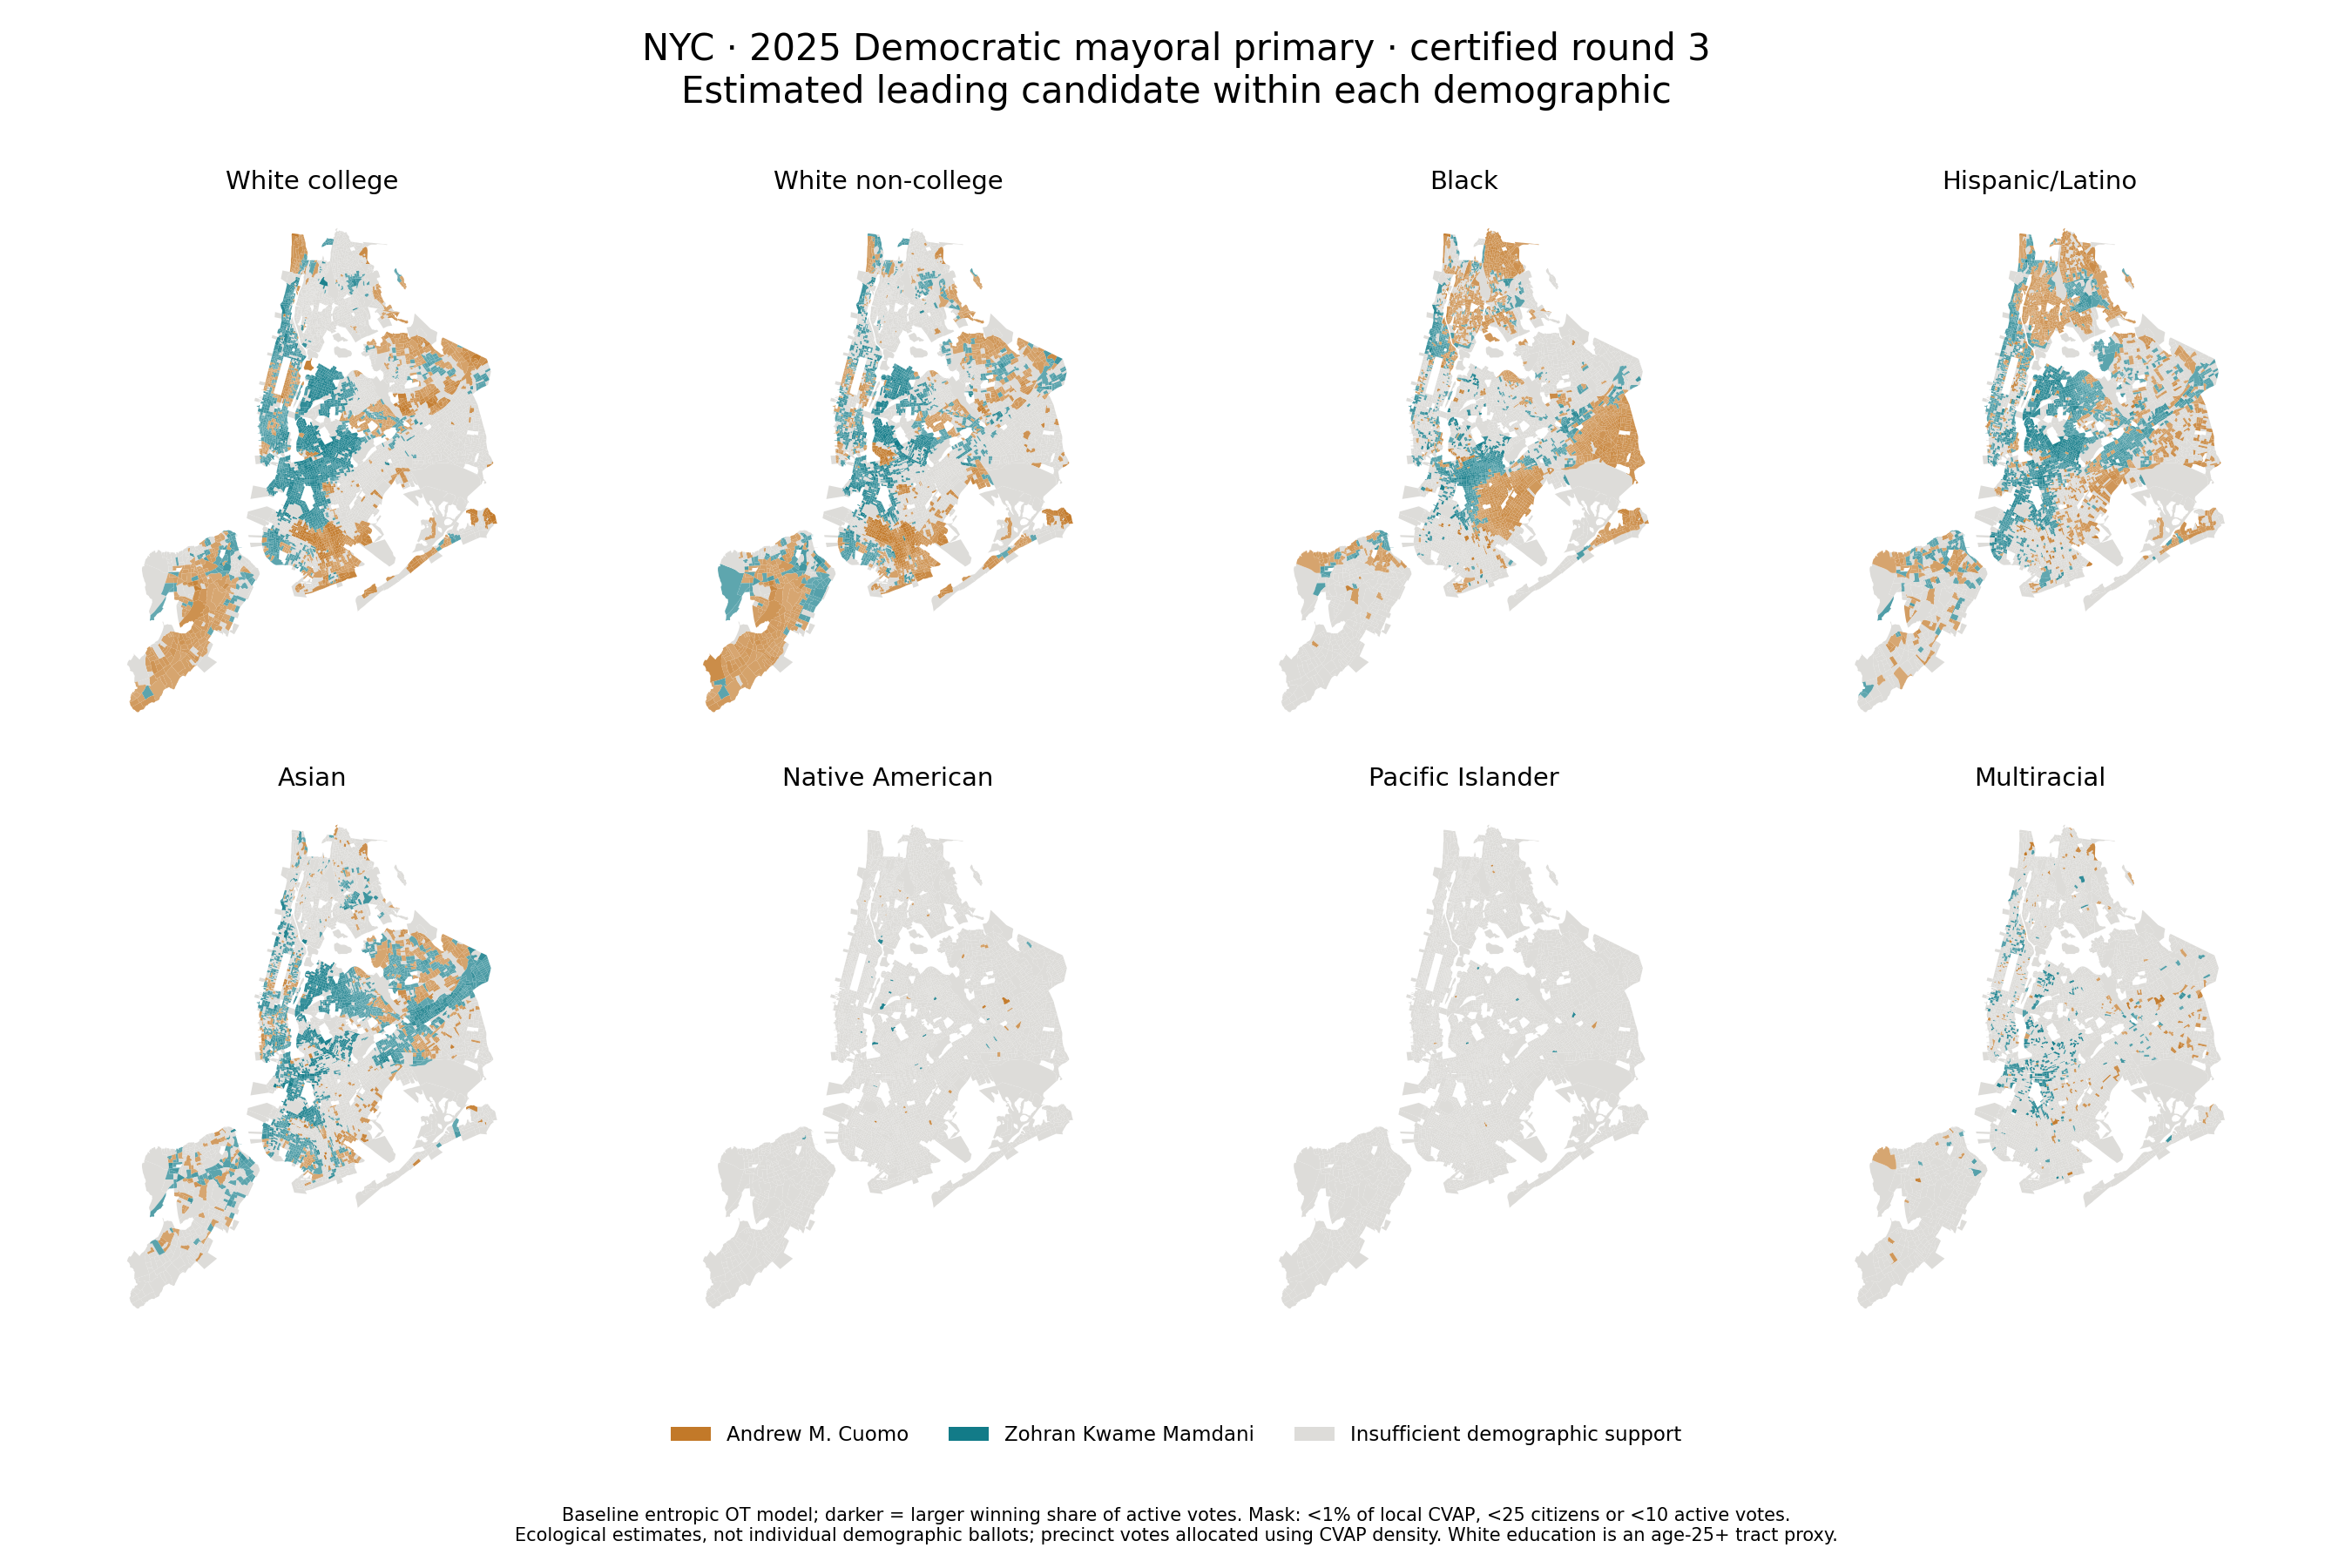
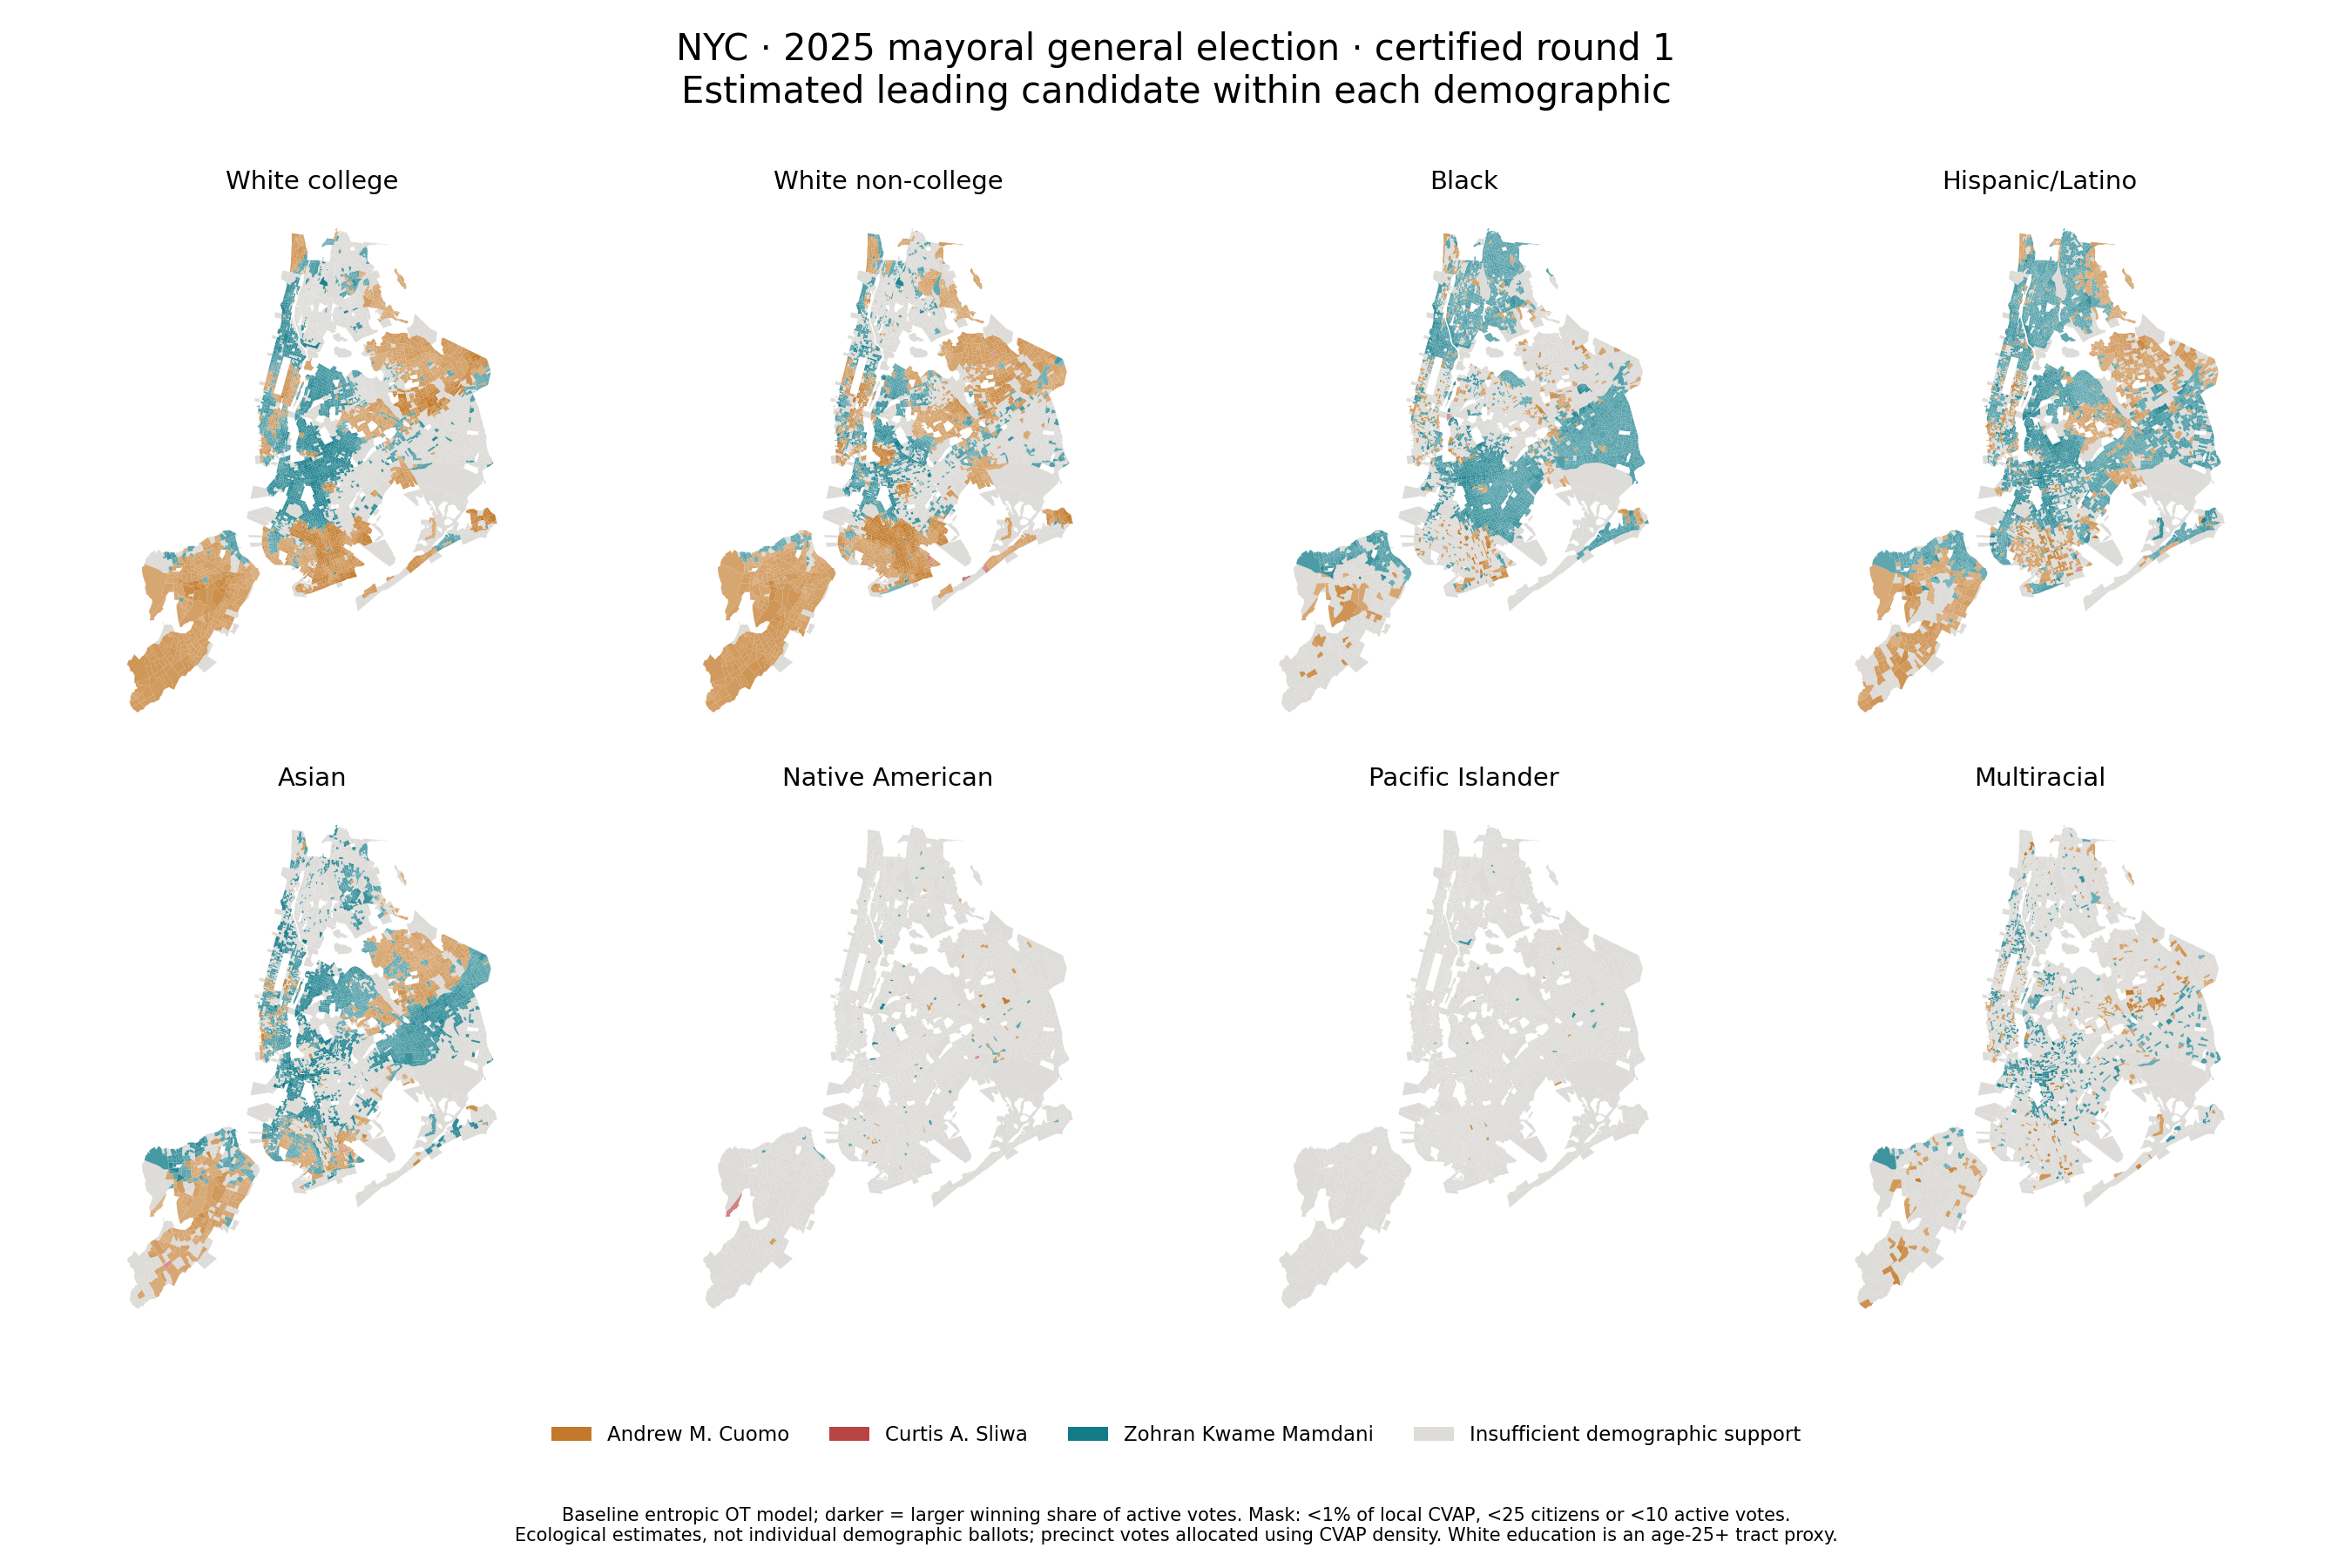
Leading candidate colors each block group by the candidate with the largest estimated share in the selected demographic. Darker colors indicate a larger winning share. Candidate shares divide by active candidate votes in that round, including write-ins while they remain active.
Inactive ballots divides inactive valid ranked-choice ballots by all participating ballots. Participation / CVAP divides active plus inactive contest ballots by adjusted CVAP. Primary CVAP includes people outside the registered Democratic electorate, so this is not Democratic voter turnout.
Gray masks groups below 1% of local CVAP, 25 citizens, or 10 active votes. Tiny Native American and Pacific Islander estimates need particular care. The filter can be disabled; these estimates remain weakly identified.
Each stage is fitted independently. A change between rounds does not reveal who transferred their ballot, and the model does not preserve individual voter identities across rounds. A unique regularized optimum is not proof of individual demographic voting behavior.
Validation
All 36 saved outputs converged, representing 20 distinct numerical objectives. Independent checks recomputed optimizer gaps and verified saved-table margins and certified totals. The maximum optimizer gap was 1.98 × 10⁻⁷. Maximum margin error was 2.73 × 10⁻¹² votes, and the largest difference from a certified candidate total was 2.33 × 10⁻¹⁰ votes.
Web exports round block-group counts to 0.001 votes; region totals are separately summed from canonical float64 fits before rounding. Percentages use sums of counts rather than averages of local percentages. The downloadable summary retains more precision.
Data and source notes
Exported demographic maps
Each image shows all eight demographics for the baseline model.
Built from the same atlas
The NYC viewer reuses the federal atlas’s MapLibre renderer, gzip loading, cache, and latest-frame pointer handling, with a new candidate-aware data adapter. Every candidate keeps their own identity; same-party rivals are never represented as opposing parties. MapLibre is distributed under its open-source licenses. Basemap © OpenStreetMap contributors; demographic geography and population from the US Census.